


Sales Forecasts
Overview
Product overview
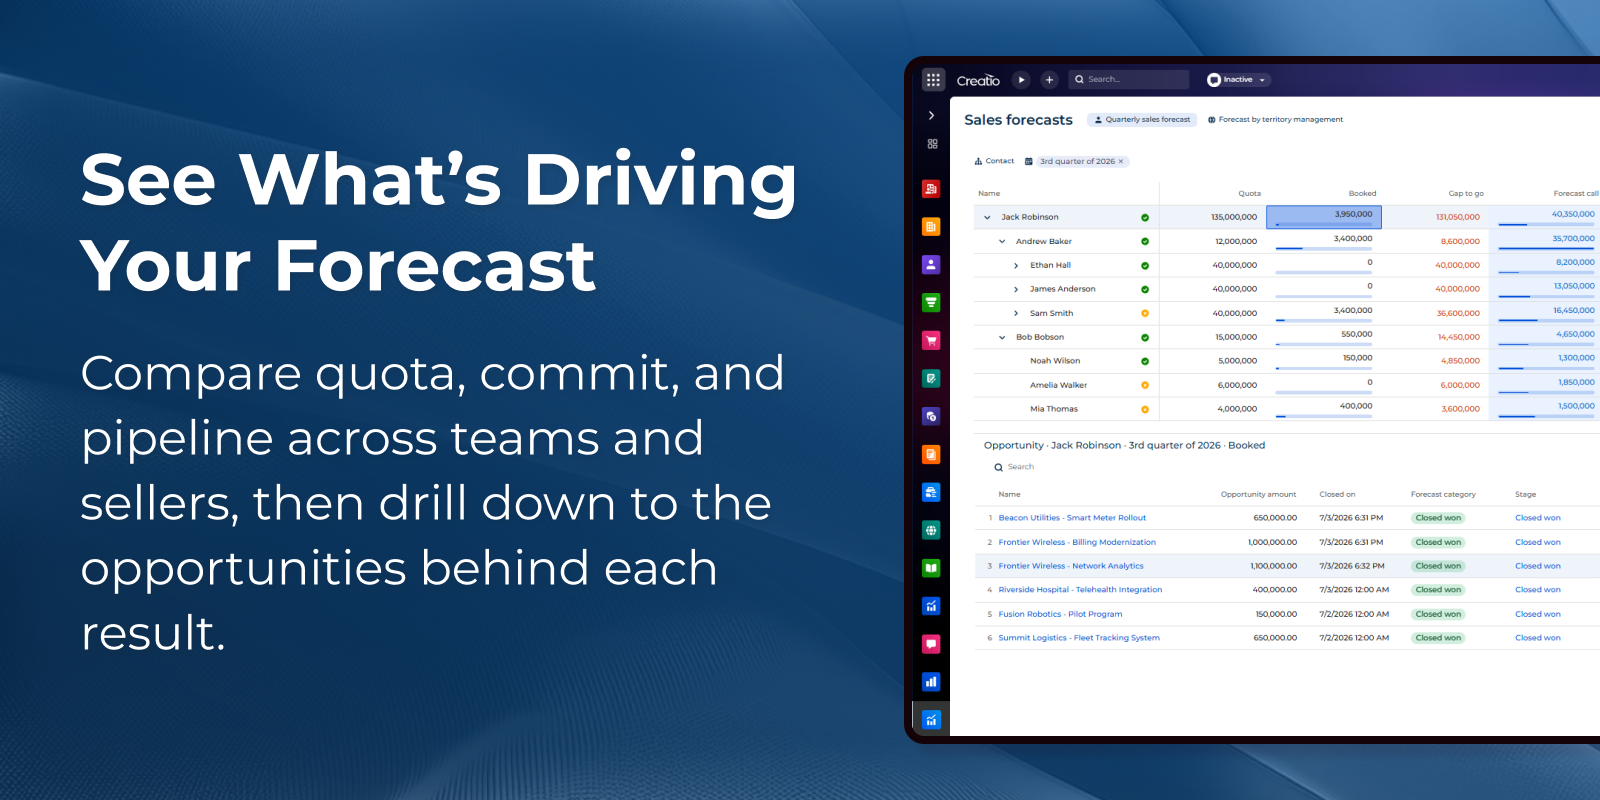
Sales Forecasts app gives sales teams structured, hierarchical revenue forecasting inside their Creatio instance. Instead of assembling numbers in spreadsheets each period, teams work with forecast sheets — interactive grids where targets, pipeline values, and committed numbers roll up through the sales hierarchy and stay connected to the underlying CRM data.
The app is designed for sales managers, team leads, sales operations, and revenue leaders who run a recurring forecast cadence and need one agreed set of numbers, clear ownership of every submitted figure, and a direct path from an aggregated total back to the deals behind it.
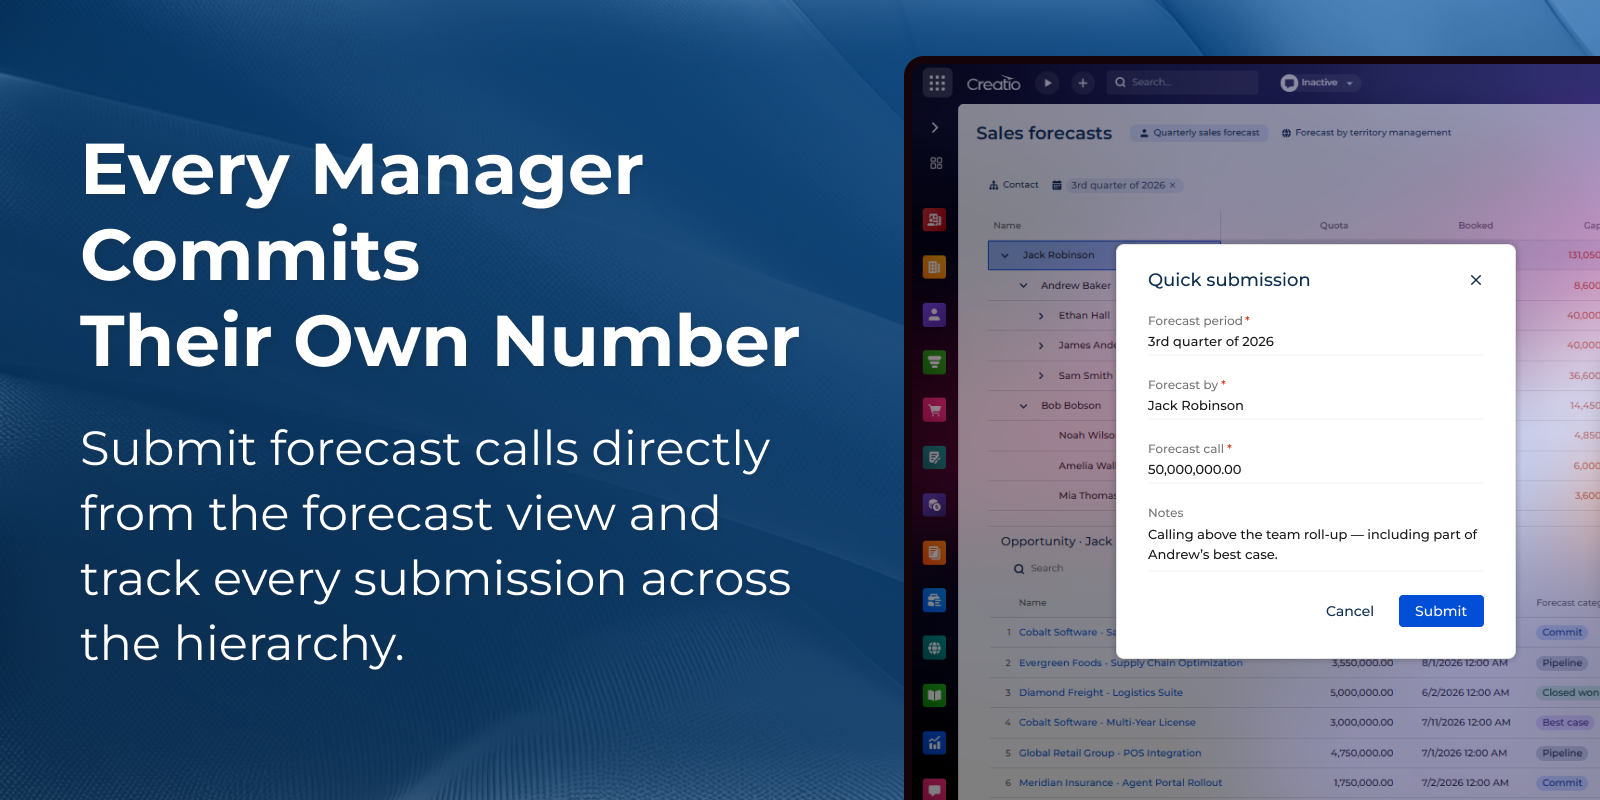
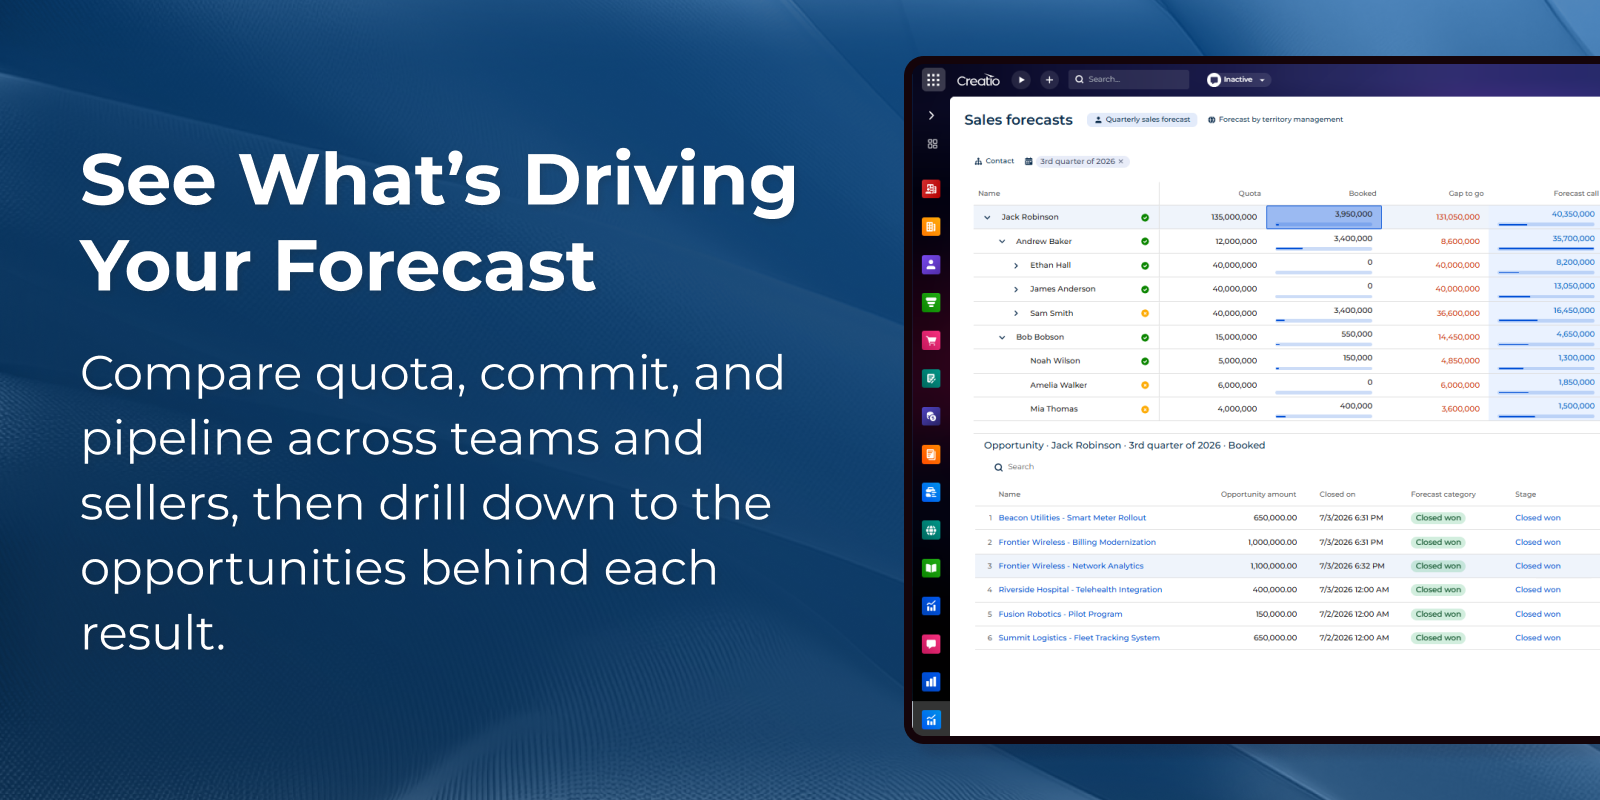
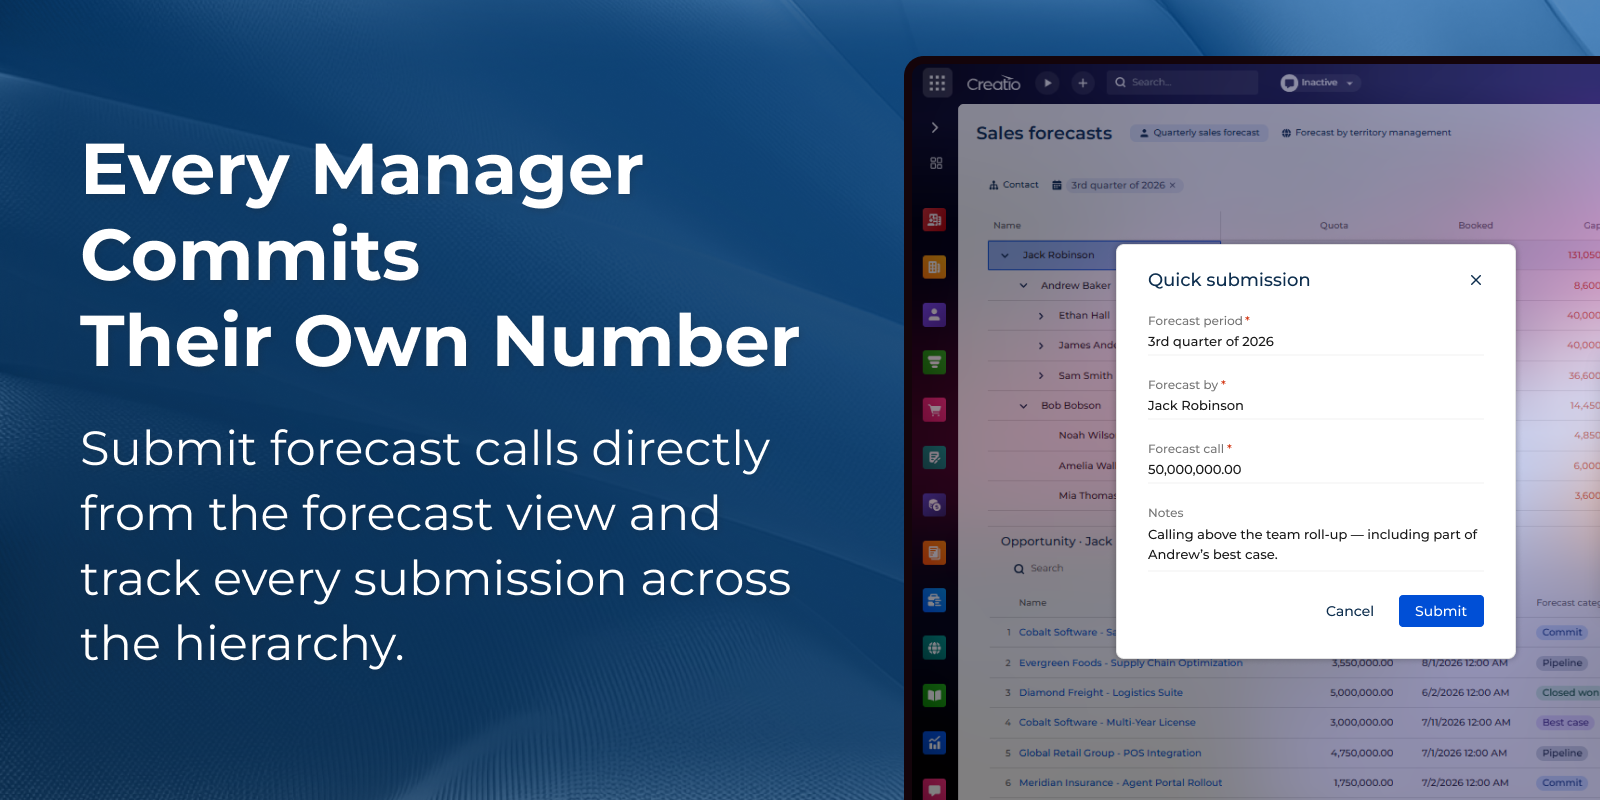
Managers work their forecast from a single sheet: they review the rolled-up numbers for their part of the hierarchy, adjust their own commit, and submit it upward — with submission status visible across the whole structure. Any figure can be drilled down level by level to the opportunities that produced it, and each opportunity opens in a side panel for review without leaving the forecast. Makers configure sheets, hierarchies, periods, and calculated columns as a composable app on Freedom UI, with no code.
Key Features
Hierarchical review with drill-down
Submitting and tracking commit numbers
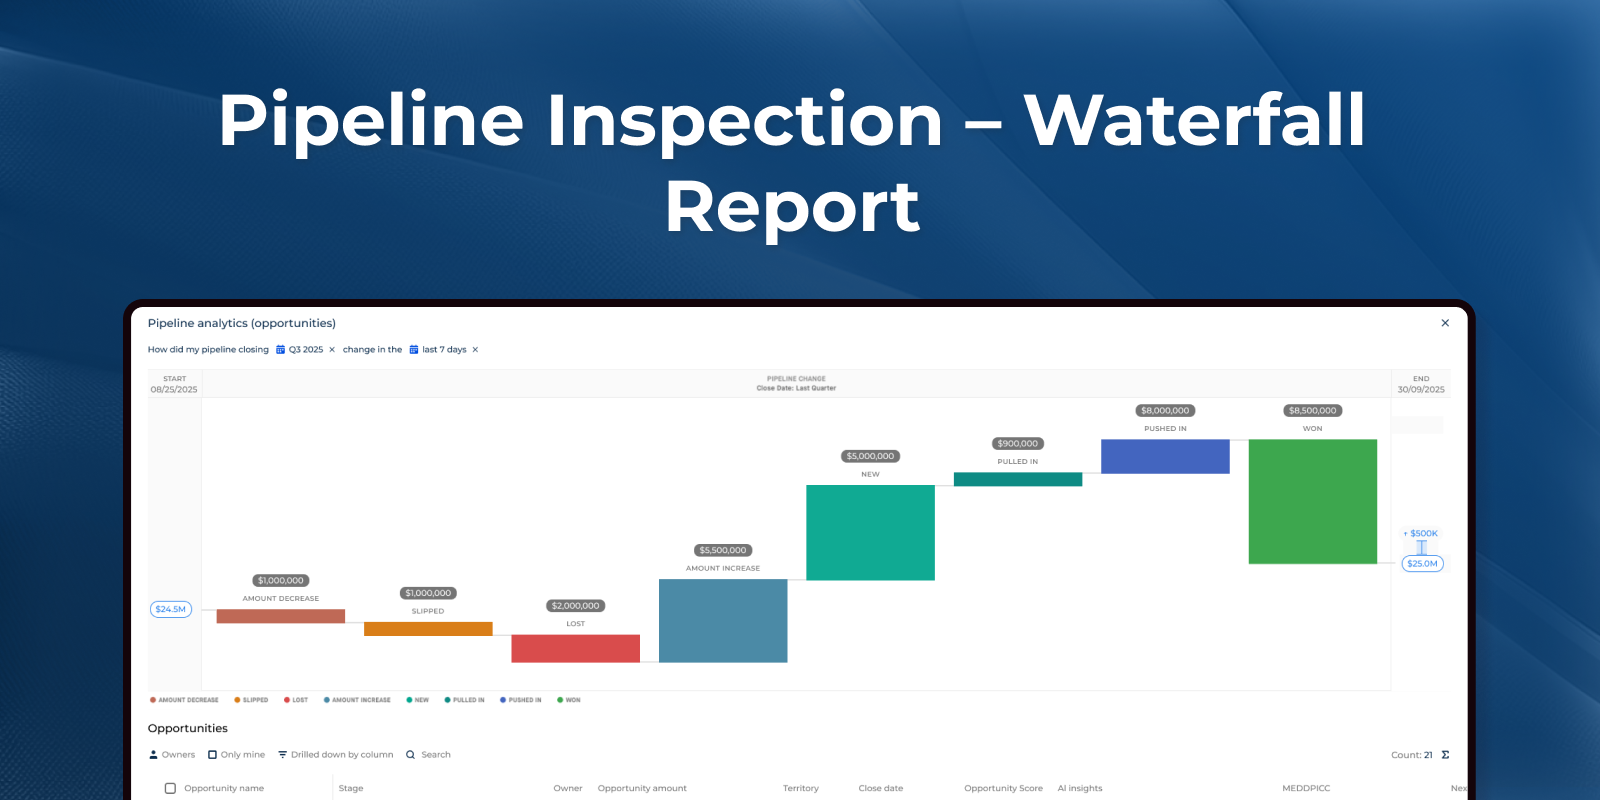
Pipeline waterfall report
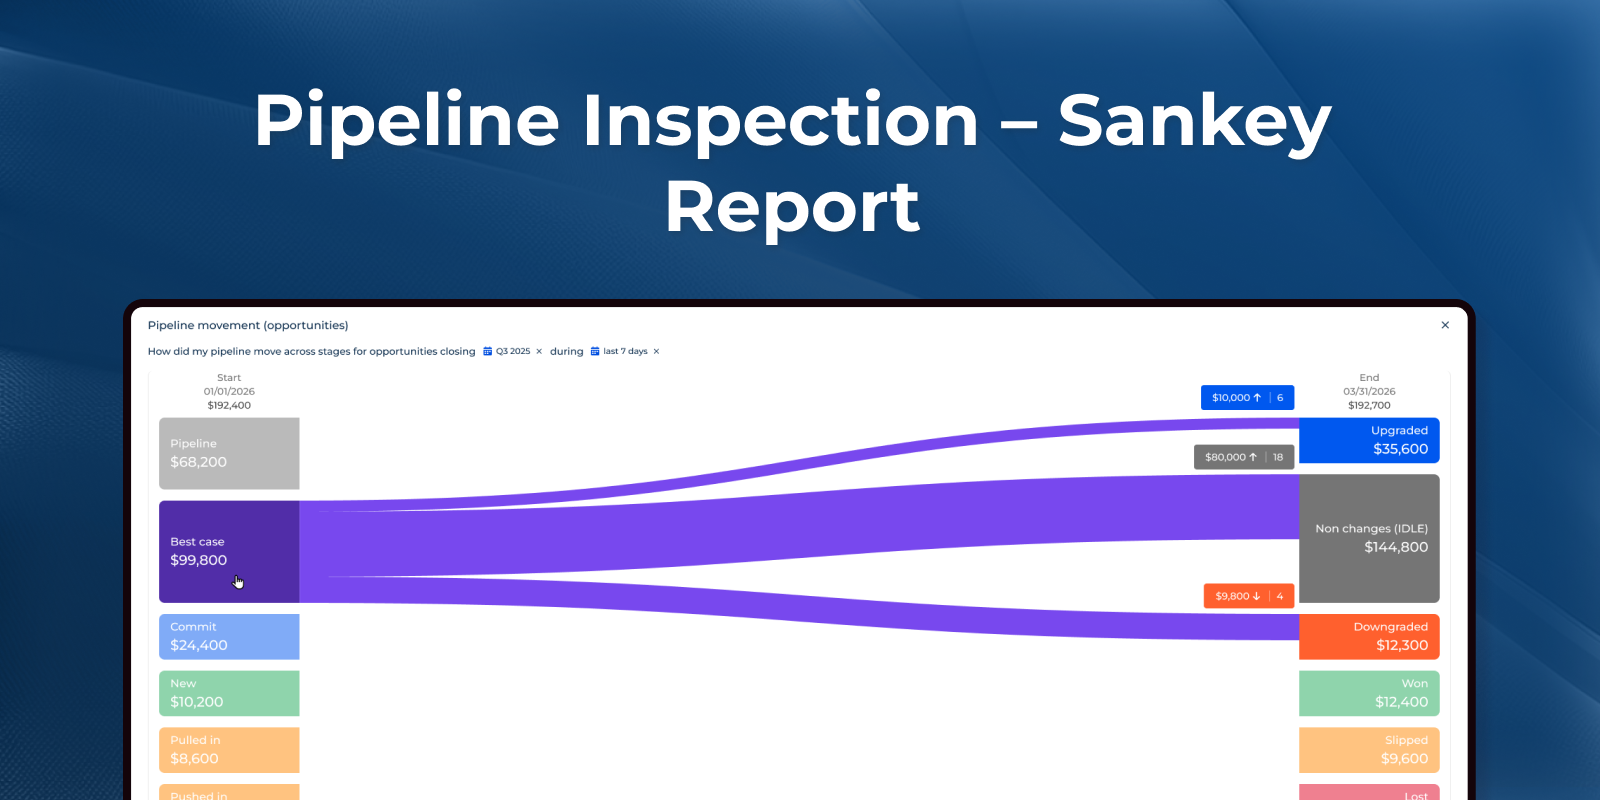
Pipeline movement report
Pricing
Terms and Conditions
Support
Installation
Setup guide
Installation
- Install the add-on from the Creatio Marketplace using the standard "Install" button.
- Select the environment where the package will be deployed and confirm installation.
- Wait for the installation to complete and press Run app button for the added application. After installation, the new Sales Forecasts workspace and related pages become available in the system.
Initial Configuration
- Open the Sales Forecast Configurations section. The application is delivered with a forecast that is already created in the system, so the recommended path is to complete its configuration instead of building a forecast from scratch. To set up an additional forecast, use the New button.
- On the General tab, select the hierarchy the forecast is built on. The hierarchy defines the structure you forecast by — employees, teams, territories, or any other reporting dimension.
- Fill in the hierarchy. Specify the Hierarchy relation field to build the structure automatically based on the parent stored in that field, or arrange the structure manually using + and drag and drop to place the nodes in the required order.
- On the Layout tab, adjust the columns of the forecast sheet to your needs. You can also use the predefined columns delivered with the application, but make sure their settings match your data structure.
- On the Permissions tab, define for each node which users can view the forecast, submit results, and manage quotas. Configure these permissions carefully to prevent the team from accessing sensitive or confidential data.
- Set the forecast as active.
Forecast Sheet Setup
- Go to the Sales Forecast section. It is also available from the Sales workplace.
- Define the periods covered by the forecast sheet.
- Add quota values per node and period if your process includes quota tracking.
Analytics and Pipeline
- Navigate to the Analytics tab within the Sales Forecast section.
- Select the Fiscal period and the Change period — both are required for the widgets to display data. The Waterfall and Sankey widgets are then generated automatically based on available data.
- Ensure that opportunities have tracking history and a populated Forecast category based on the opportunity status to populate all dashboards accurately.
Verification
- Open the active forecast and confirm that all nodes are displayed and parent nodes correctly aggregate their children's totals.
- Use drill-down on a value-from-object column to confirm that the underlying records are the expected ones and that formula columns return correct values.
- Confirm that forecast values are updated according to the selected update mode.
- Log in as users with different permissions and confirm that each one sees only the nodes and actions they are allowed to.
Data sharing
- By installing or downloading the App, you confirm that you agree with sharing your account data (name, email, phone, company and country) with the App Developer as their End User.
- The App Developer will process your data under their privacy policy.
Versions
Versions history
Manual app installation
- Open the needed app → the Packages tab - download the Markeplace app files.
- Click in the top right → Application Hub
- Click New application. This opens a window.
- Select Install from file and click Select in the window that opens.
- Click Select file on the page of the Marketplace App Installation Wizard and specify the app file path.