SalesUp Data Management for Creatio
Overview


Product overview
SalesUp Data Management for Creatio is a multifunctional tool for planning, budgeting, and performance management at all levels of a company. It enables users to work with financial and quantitative targets, compare planned and actual results, build complex models using advanced formulas and logic, and perform real-time calculations on large volumes of data. The solution supports custom reporting periods, flexible formatting, role-based filtering, and user profile customization.
This product is especially valuable for teams that require a transparent strategic planning process, precise budget control, and real-time data analysis. A convenient drag-and-drop data structure editor, Excel export, detailed change logging, and access via widgets make it easy to tailor the solution to each user's needs, transforming it into a powerful decision-making platform based on relevant data built on the Creatio foundation.
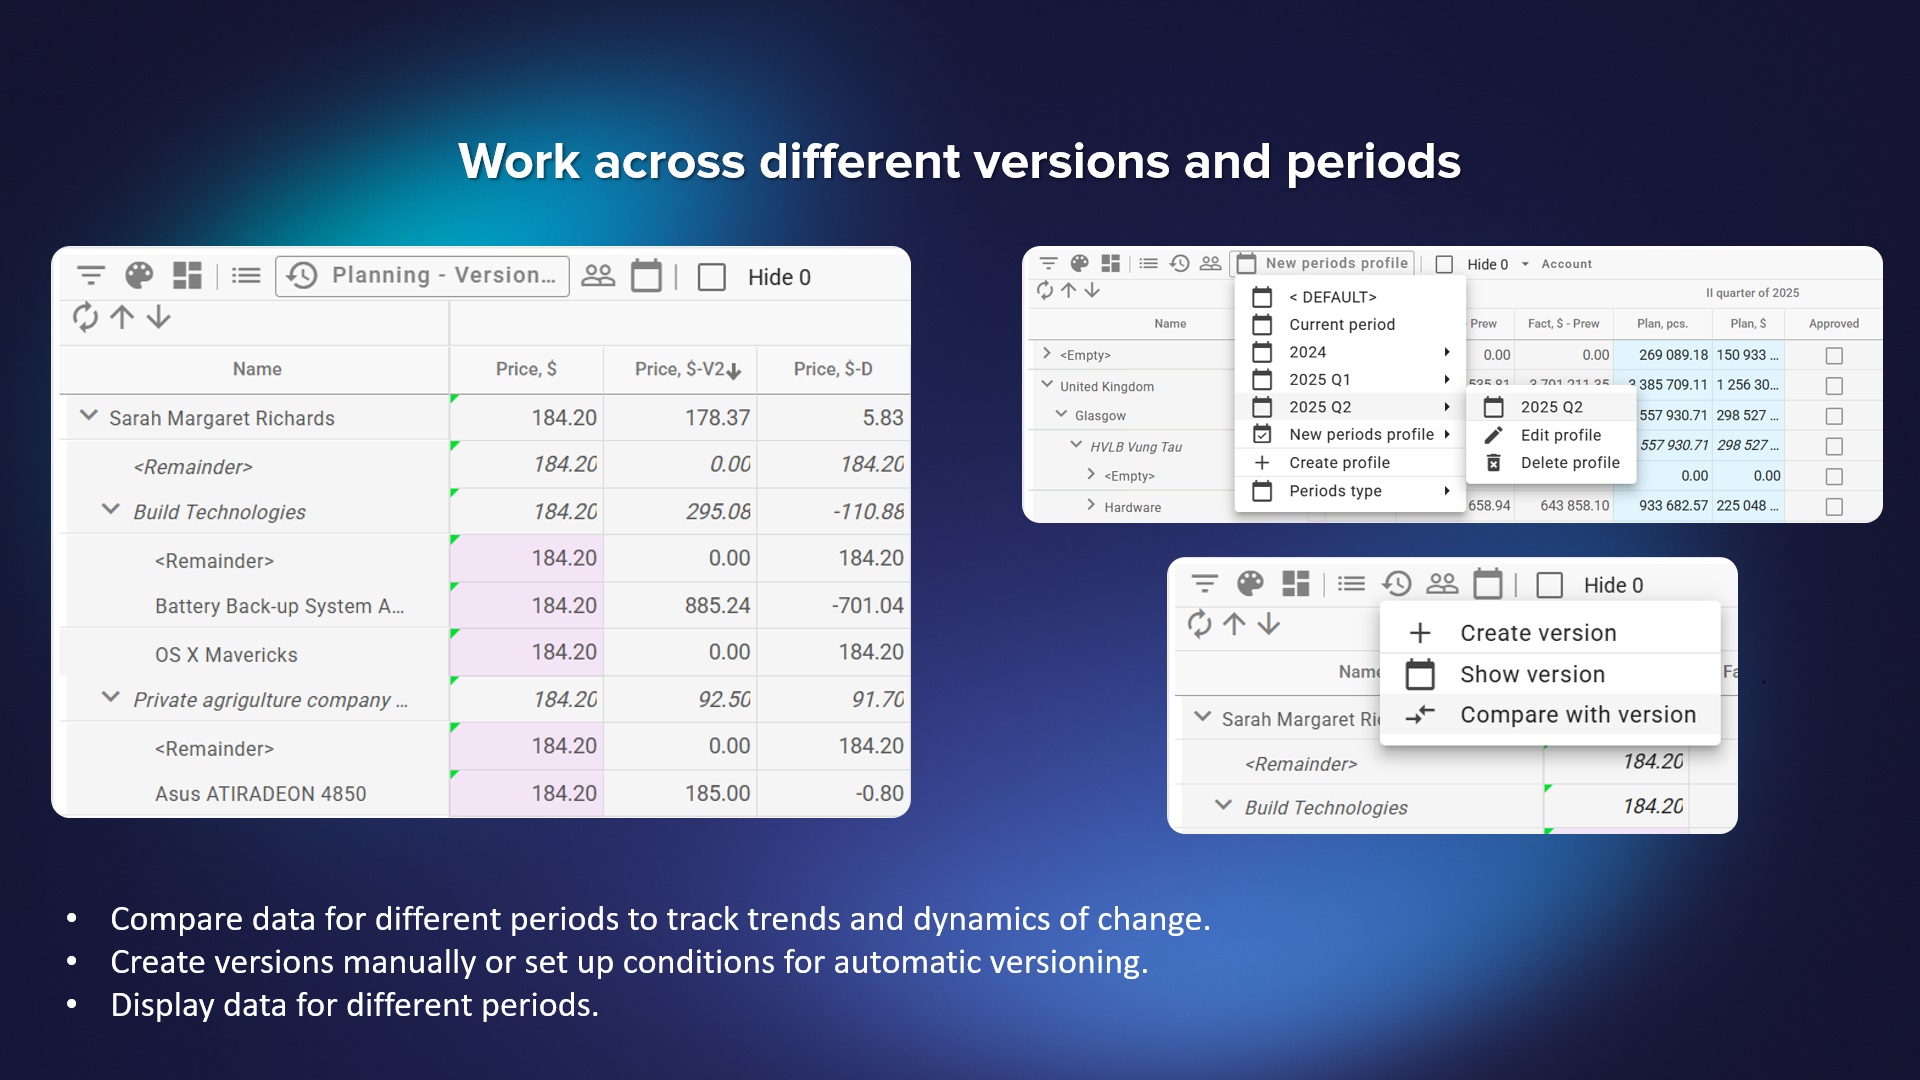
Manufacturing and distribution companies use the solution to plan production and sales volumes, budget trade and commercial investments, and track KPIs across business units, plants, warehouses, and distribution channels.
Use cases:
- Maintaining a budget at the level of the entire company with the ability to store and compare versions when reallocating or transferring funds;
- Strategic planning of medium and large sales departments (with the possibility of planning from the bottom up and vice versa);
- Comparison of planned and actual values of the company's sales with the possibility of detailing to a business unit or an individual employee;
- Calculation of employees’ KPI online
- Automation of credit analysis at a bank: importing data from the banking system, automatic calculation of assets, liabilities, balance sheet trends, and borrower creditworthiness ratios;
- Hierarchical financial reports “Account → Request → Sections → Categories → Indicators” with automatic calculation of deltas, trends, and forecasts, and support for custom quarterly slices;
- Consolidation of indicative financial statements from three perspectives — balance sheet, P&L, and cash flow—with manual balance sheet adjustments, recalculation of formulas, and a full audit of changes for the credit committee.
- Planning production volumes, sales targets, and trade-marketing budgets, and tracking KPIs across business units, plants, warehouses, and distribution channels for manufacturing and distribution companies.
Key Features

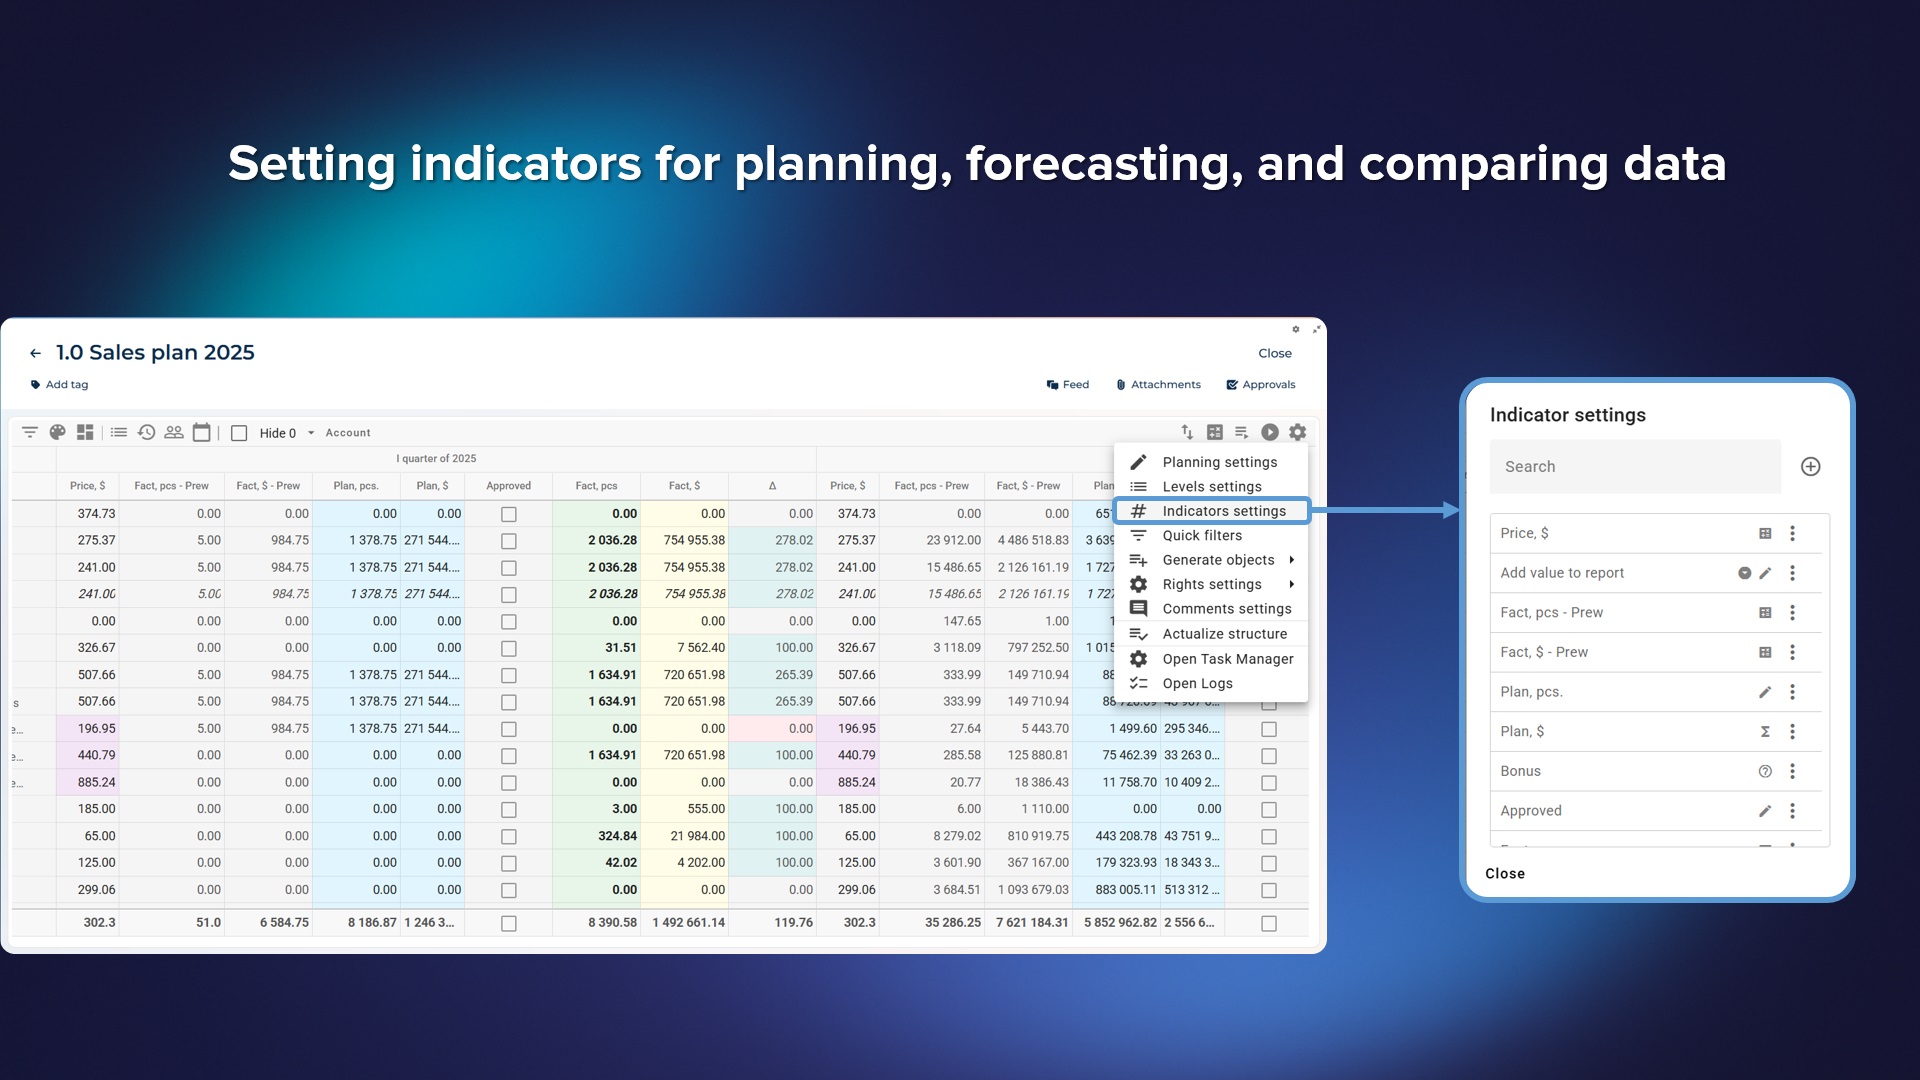
Automatic data calculation

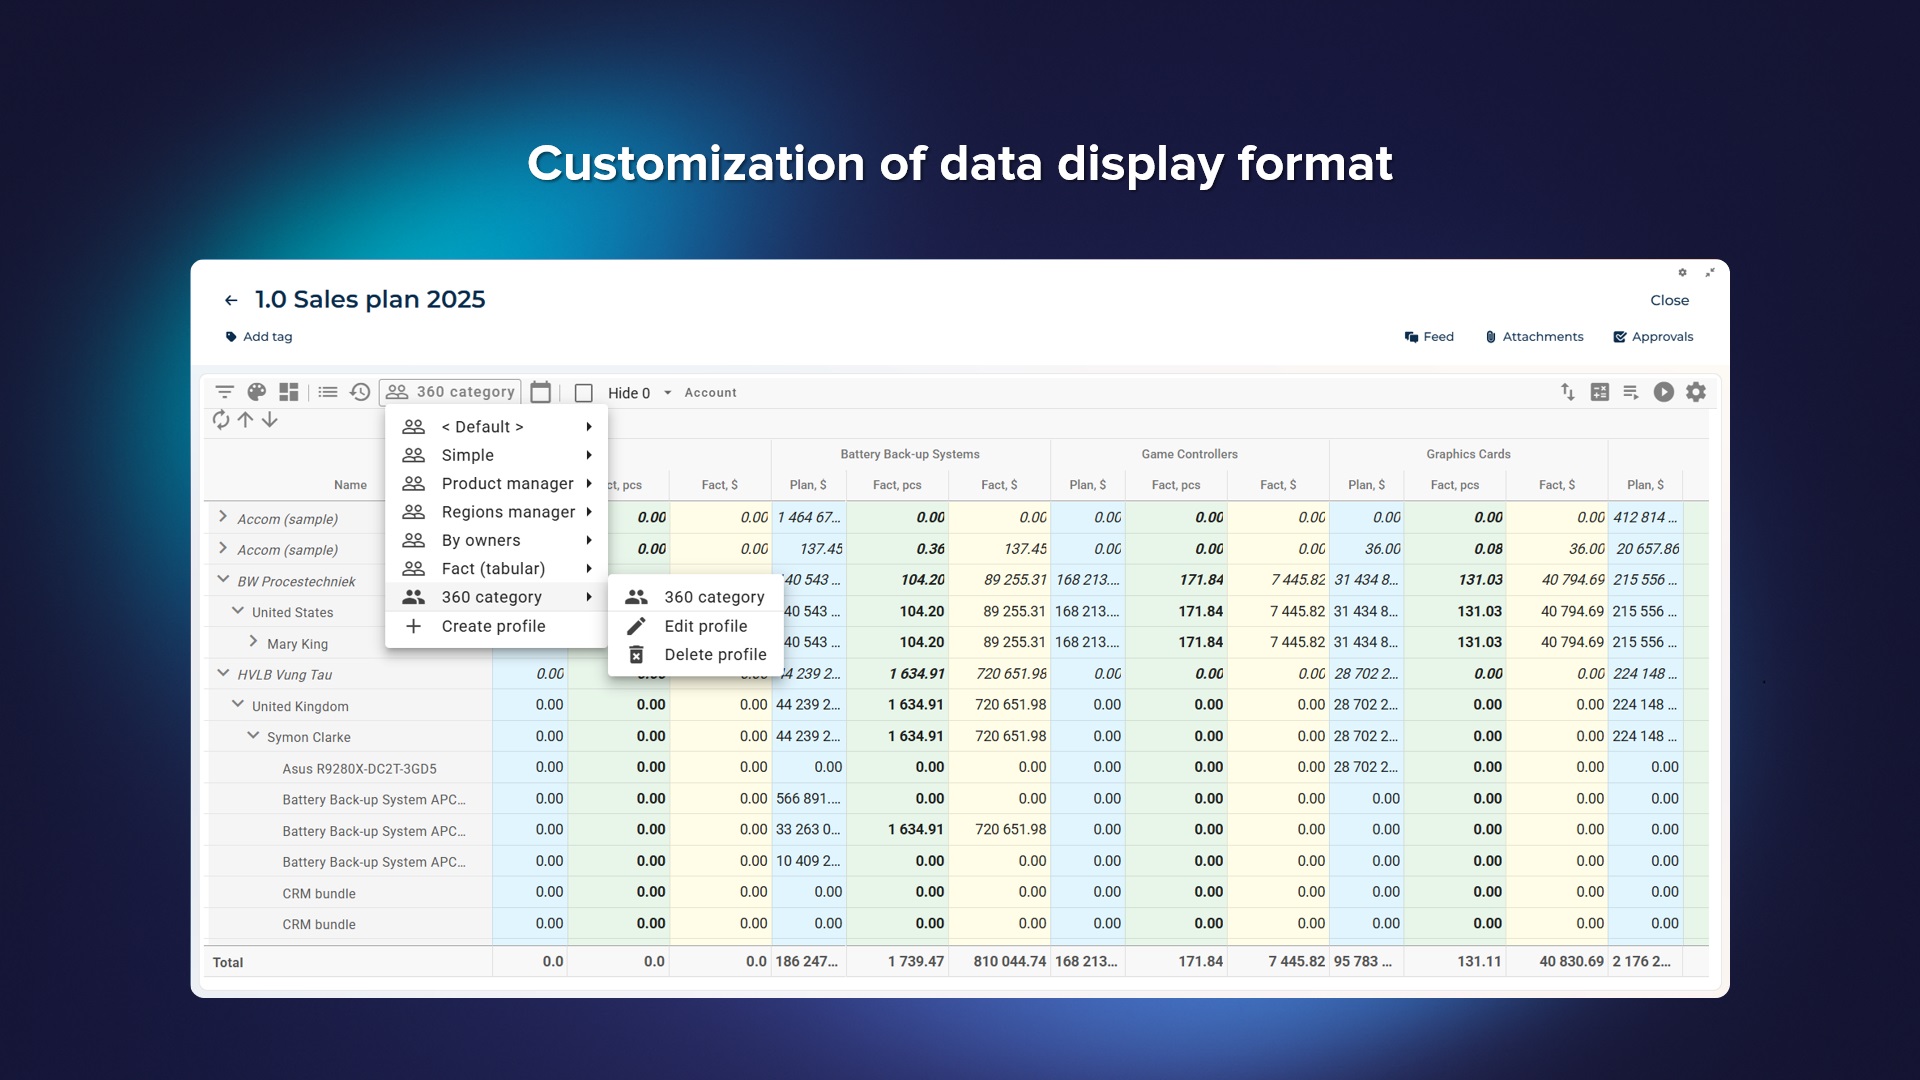
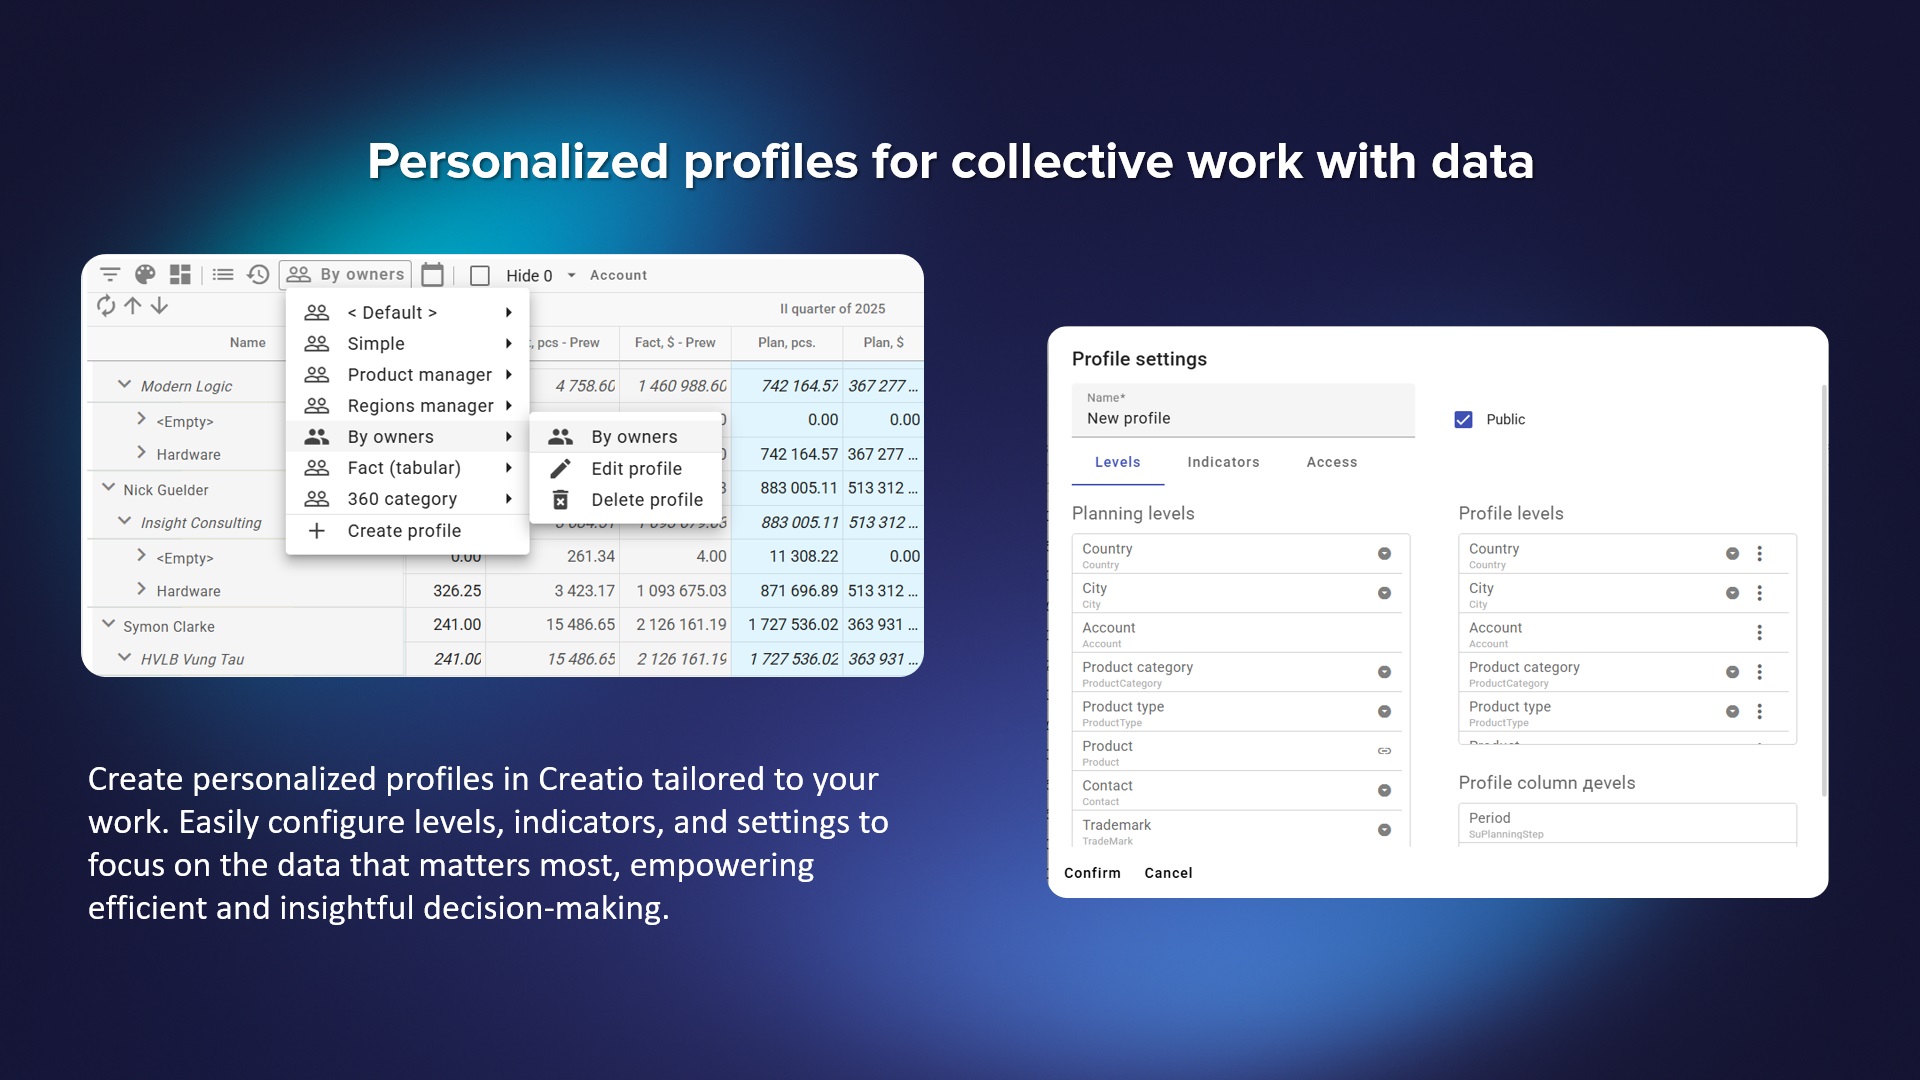
Personalized profiles and DM360

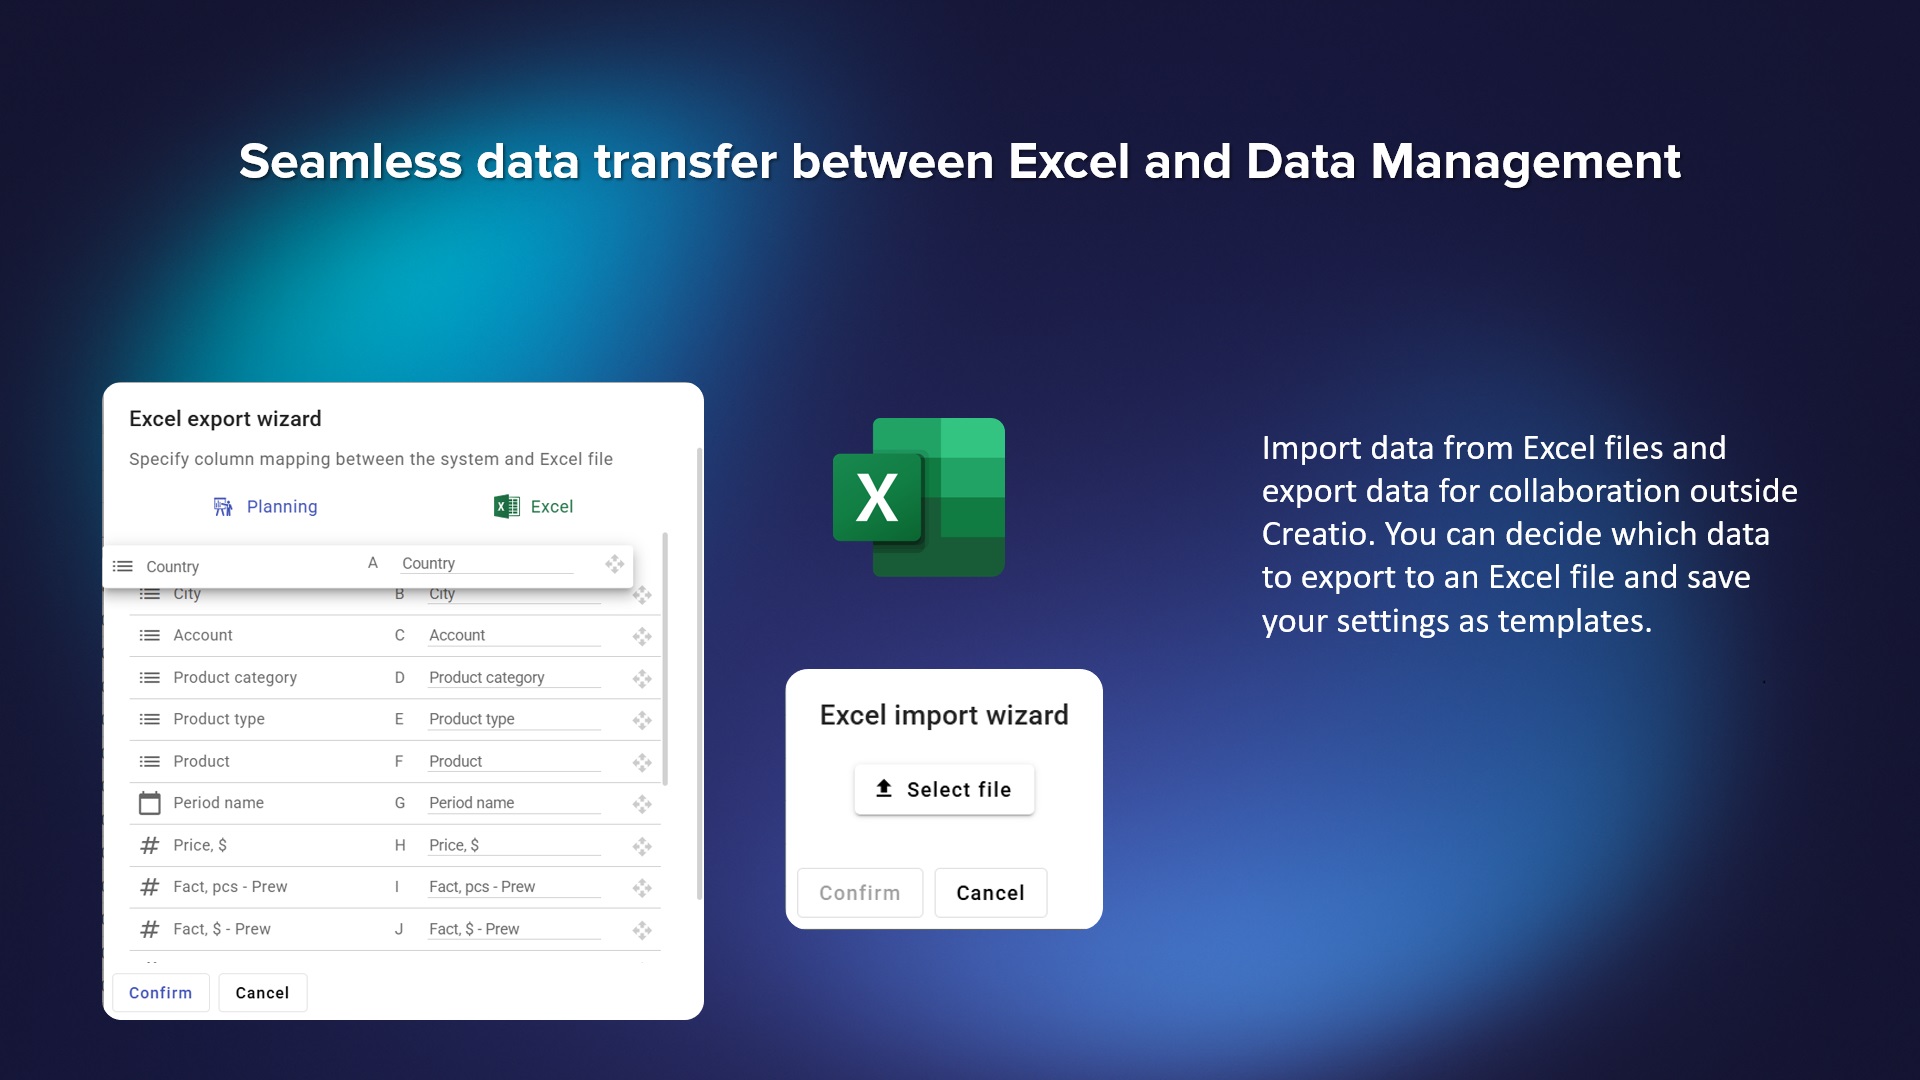
Excel Export/Import

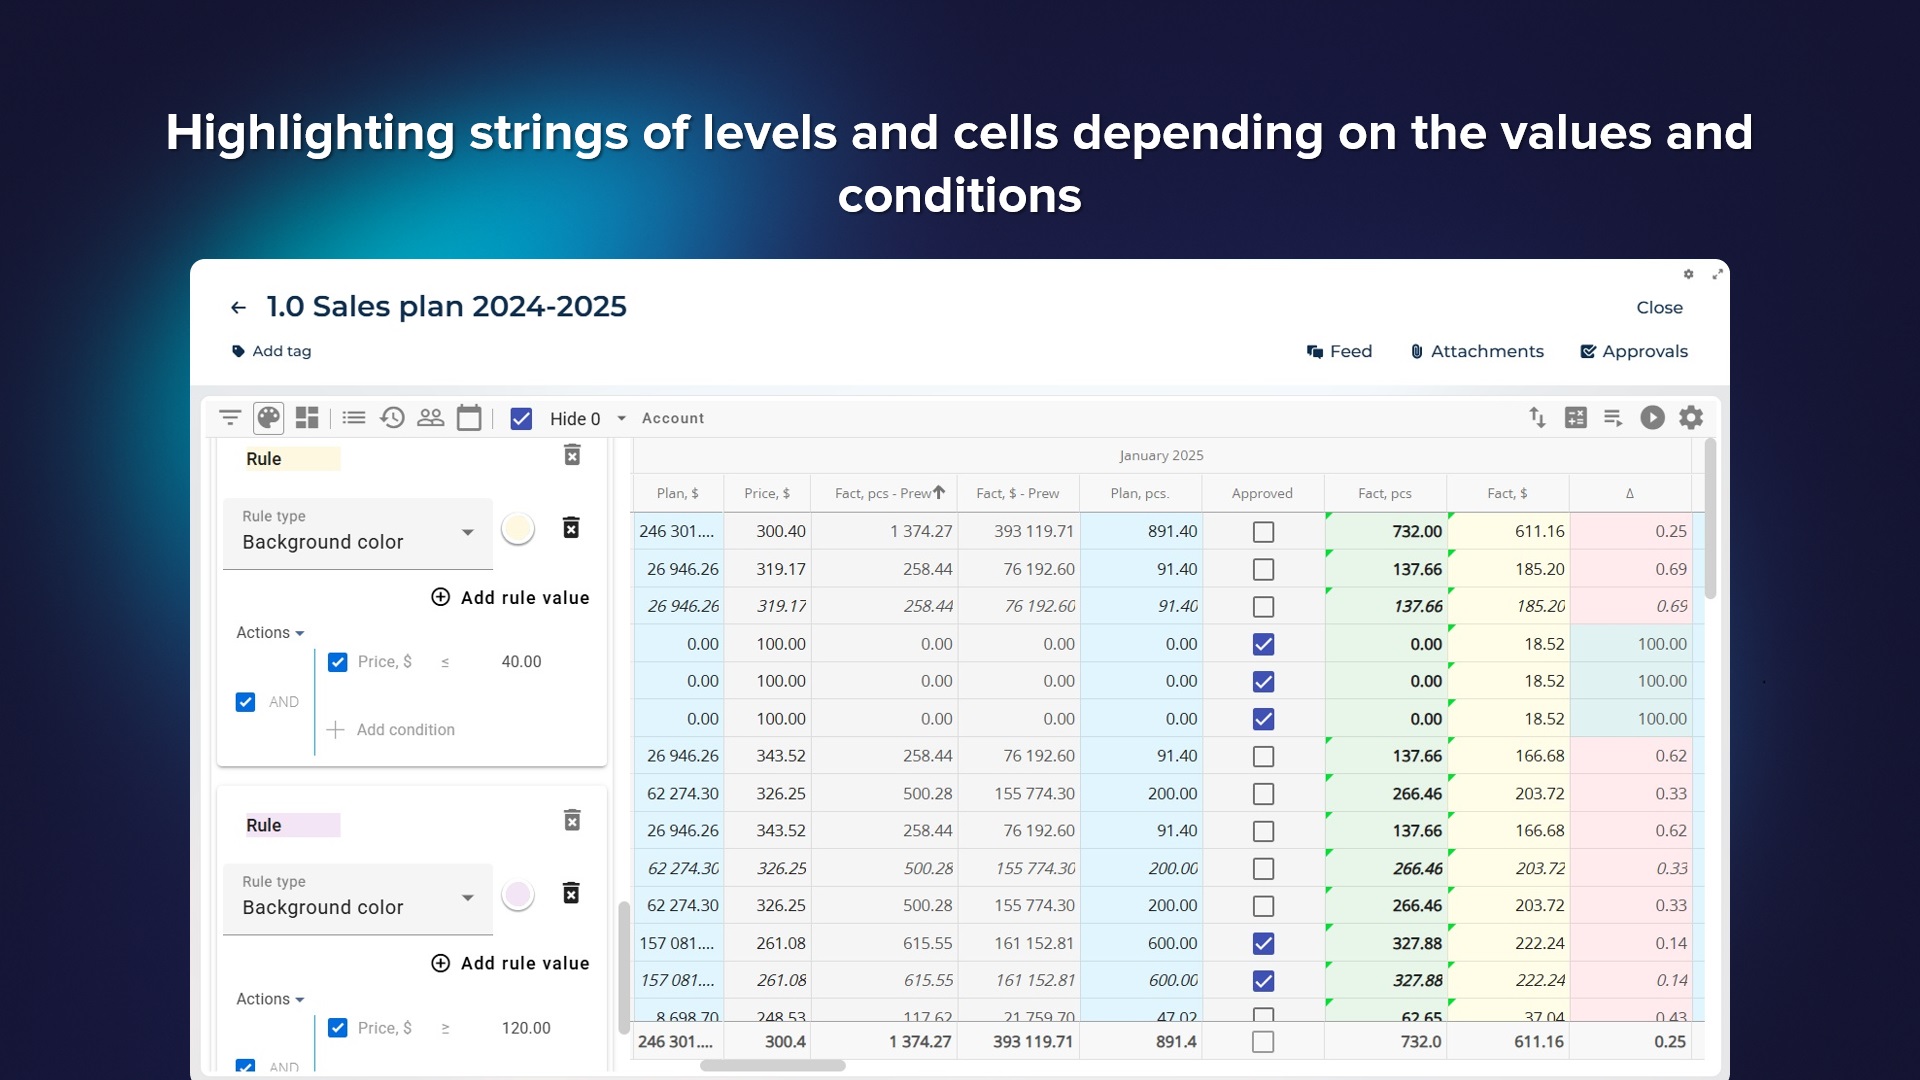
Conditional Data Formatting

Collaborative Comments with Notifications

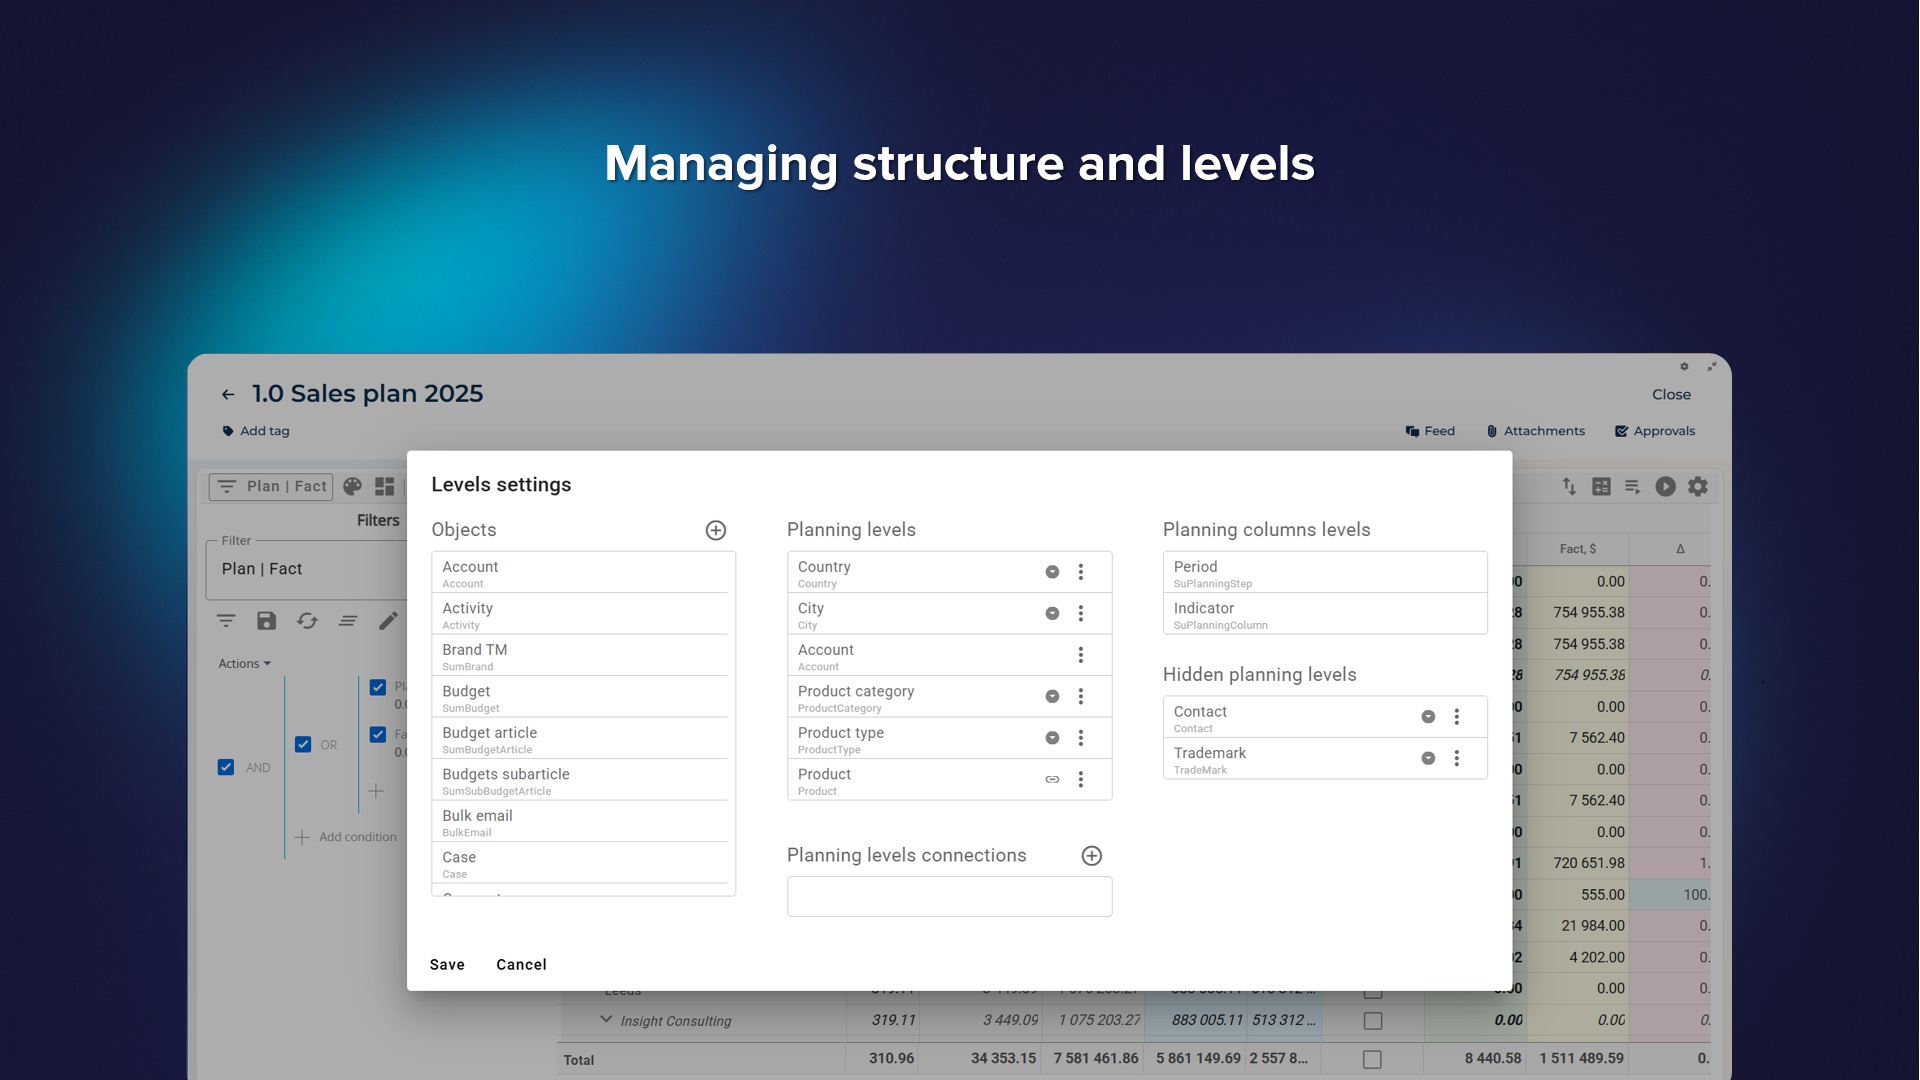
Object Generation

Smart data filtering
Pricing
Terms and Conditions
Support
Installation
Setup guide
There are two ways to install the application:
- Automatically - by specifying the site address and clicking the "Install" button
- Manually - by downloading the archive with packages and installing by the application installation wizard.
To request SalesUp demo licenses for 14 days:
- Go to the "SalesUp License Manager" in the system designer.
- Click the "Request licenses" button.
- In the modal window that appears, select the product, fill in the company name, email for communication and click the "Submit" button.
A temporary license of SalesUp for 14 days will be installed independently.
Resources
Data sharing
- By installing or downloading the App, you confirm that you agree with sharing your account data (name, email, phone, company and country) with the App Developer as their End User.
- The App Developer will process your data under their privacy policy.
Versions
Versions history
- Version 8.3.2 fix
Excel import and export have been fixed for Creatio version 8.3.2. - Other minor fixes
Fix UI localizations
- Version 8.3.2 fix
Styles have been fixed for Creatio version 8.3.2. - Other minor fixes
Fixes when Excel import a lot of columns and fix UI localizations
- Support for multiple currencies in planning slices - Different users can enter data in different currencies, and each of them will see their team memebrs’ data correctly;
- Conversion to the required currency in calculated indicators;
- Taking into account connections between levels when importing from Excel if there are records with identical names;
- Ability to skip levels for display if they contain only one record "Empty";
- Minor bug fixes.
- Support for multiple currencies in planning slices. Different users can enter data in different currencies, and each of them will see their team memebrs’ data correctly.
- Conversion to the required currency in calculated indicators.
- Bug fixes.
Extended comment functionality, along with a separate panel where you can view all comments from all plans. When clicking on a comment, the system automatically opens the corresponding plan, row, and cell, and displays the comment.
2. Sorting.
One-click ability to sort the table not only by name (as before) but also by the value of any metric in any column.
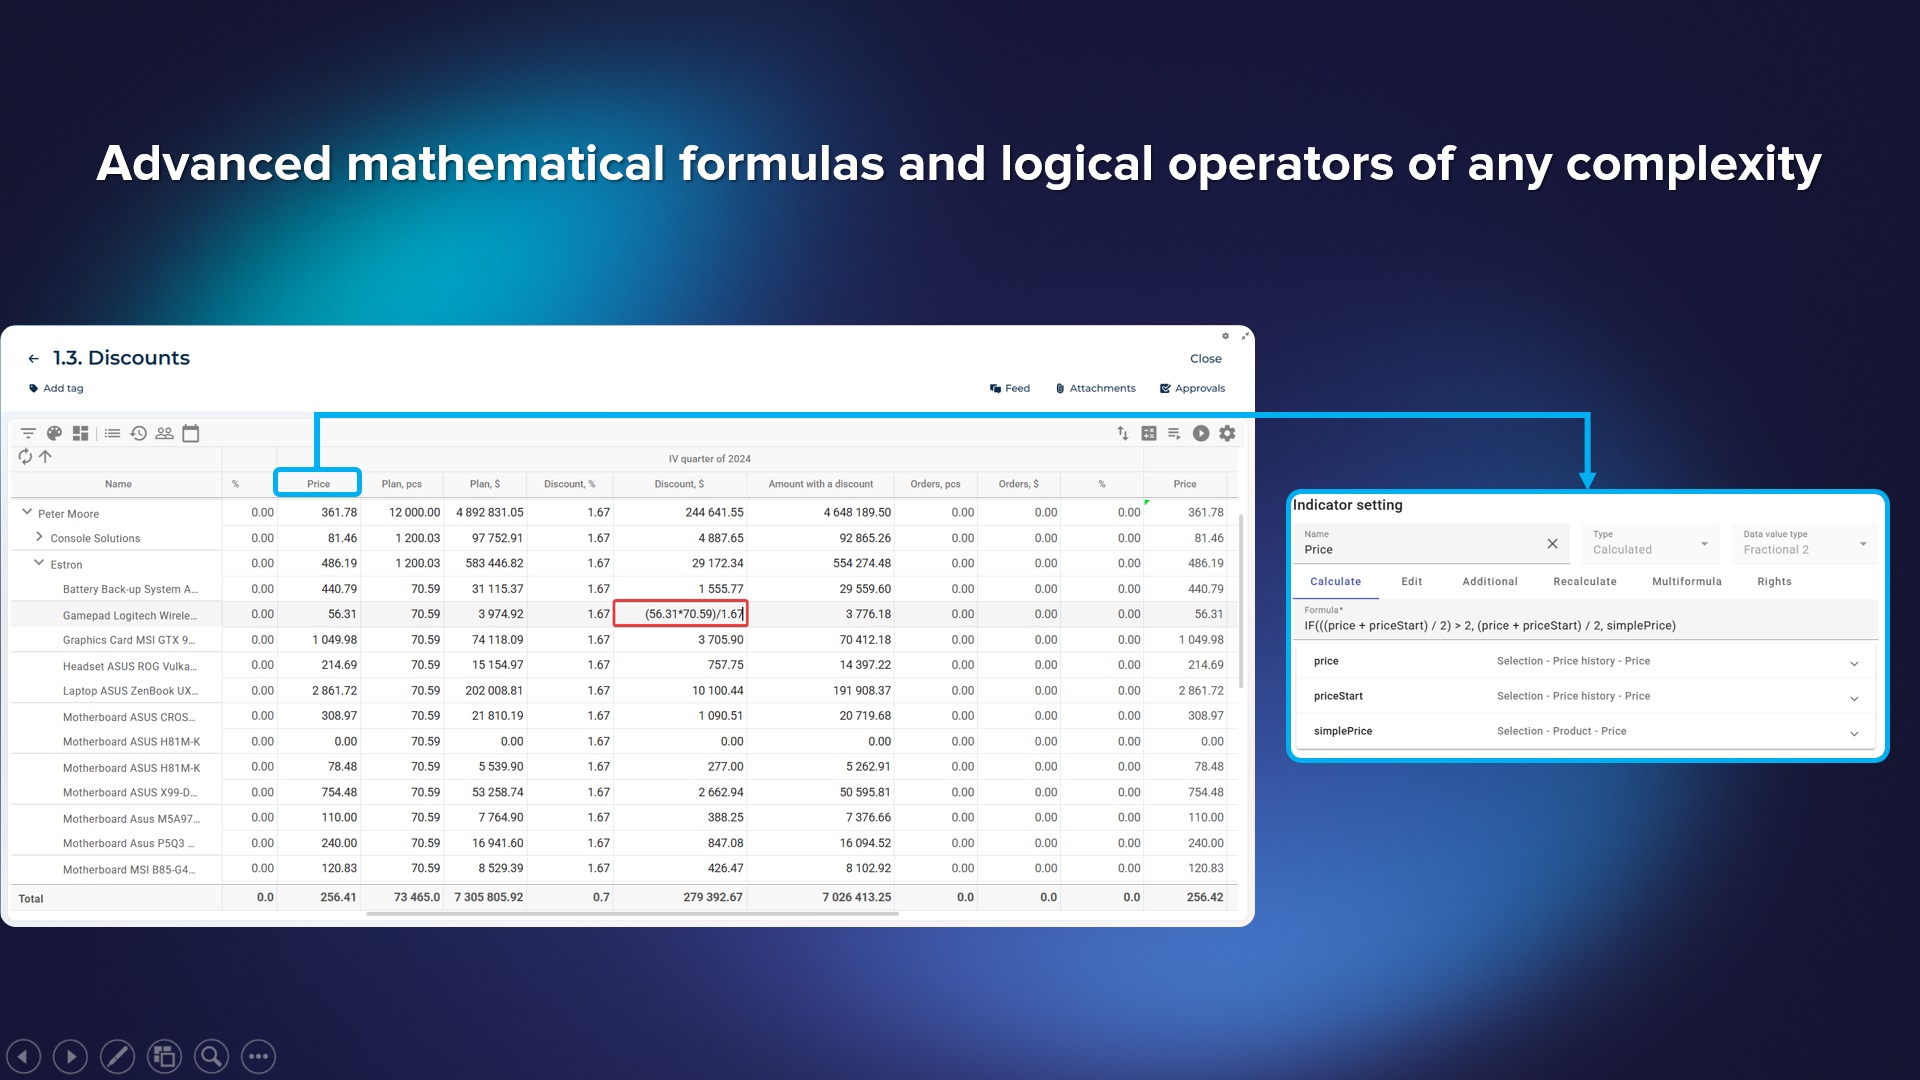
3. Formula in a cell.
The ability to enter a formula into a cell, similar to Excel. The system automatically calculates the formula and saves the result in the cell while preserving the entered formula.
4. Expand all for a row.
A new action available in every table row that expands all hierarchy branches downwards without the need to expand the entire table or click multiple times on arrows.
5. Default profiles.
The ability to set a default profile and default period profile by role so that each user immediately sees the data in the format they need.
6. Export of related columns.
When generating a report, you can include columns that are not configured in the planning table but are pulled from object levels, such as the counterparty code or a link to a product’s online page.
7. Export optimization.
Previously, generating reports with hundreds of thousands of rows heavily loaded the system. Now everything works stably and correctly without negatively affecting system performance. 8. Grid settings.
All settings are completely moved to the grid:
- Periods
- Records rights
- Indicators rights
- Logs
The planning section and page in Freedom UI.
The ability to make one or more editable levels in the planning hierarchy optional (not required). For a planning slice where the responsible manager plans sales by product by account (structure: Contact → Account → Product), each of the levels is mandatory. However, by setting the level as optional, it ceases to be mandatory.
This way, cases are covered:
- The manager plans to sell a product for a certain amount, but may not specify to whom the product will be sold;
- The manager plans sales for the next month by account for a certain amount, but does not specify which product will be sold for this amount;
- The manager plans sales for a certain amount, but does not specify to which account and which product will sell for this amount.
Provides the ability to add several formulas with filtering in one column. Lines that match the formula filters will be calculated using separate formulas (taking into account the priority of the formula), and lines that do not fit the filters will be calculated using the standard formula. Additionally, for a multi-formula, filtering is available to group those records for which the multi-formula should be applied.
3. Planning level relationships
- The "Planning level connections" block has been added and the interface of the level settings menu has been changed.
- Added the "Use for import" action - helps to use the configured level connections to import a planning slice into an excel file.
- Added the "Add record" function to quickly add a record for any planning level.
- Added the "Add record (extended)" function to add a child record for the selected planning level.
A checkbox "Calculate when adding a record" has been added for the calculated indicator. After activating the checkbox, when manually adding records, you do not need to perform a calculation action to pull the value into the grid, the value will be pulled automatically.
6. Remainder value for the indicator
For the "Editable" indicator type, an additional setting "Save value as remainder" has been added. When you activate the checkbox, the "<Remainder>" level appears on the planning grid (not available for editing).
7. Text and boolean indicators
- The text types of indicators "Text" and "Text (long)" allow you to add text values to the planning slice and display the added text as a comment.
- The "Boolean" indicator type is displayed in the slice as a checkbox.
A new feature that allows you to save the configured conditional formatting of the planning slice by default for all users.
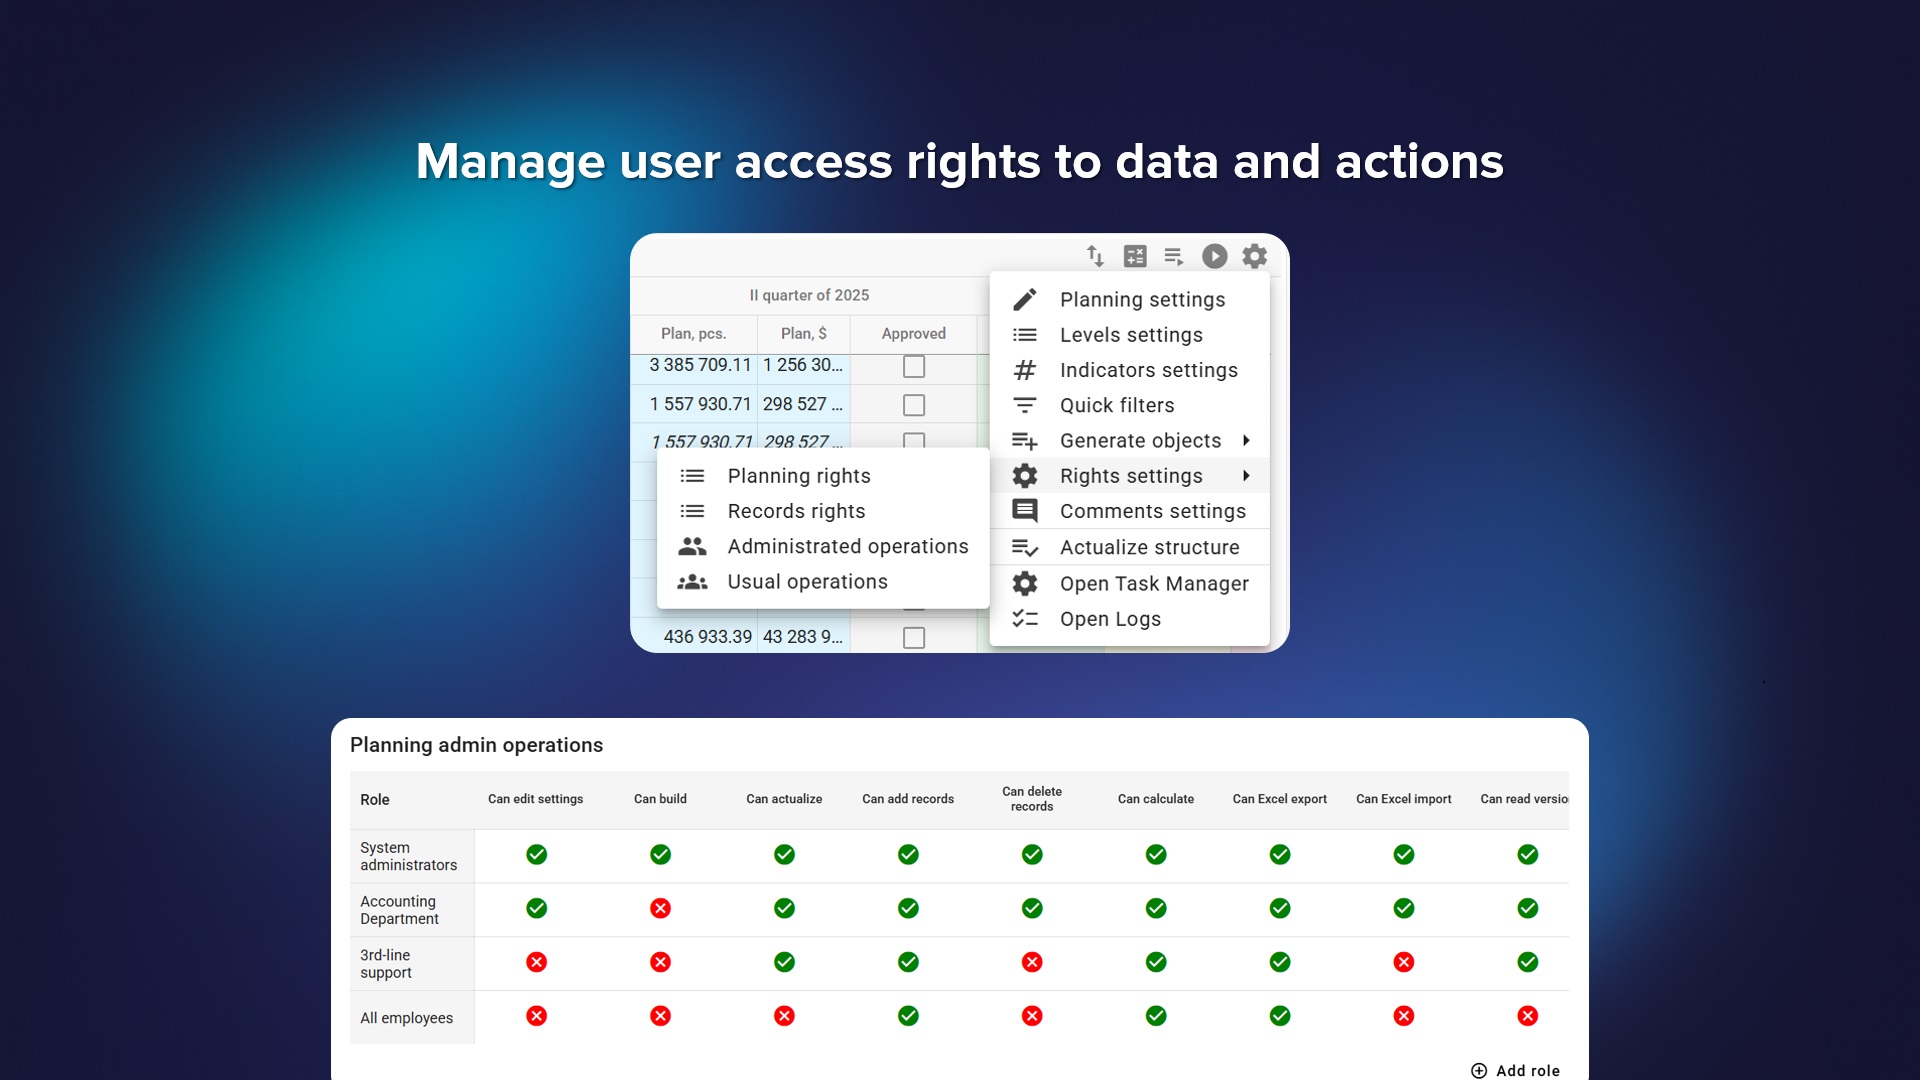
9. Access rights
- Added consideration of the configured rights when importing data to excel.
- The "Rights" detail has been replaced by an extended "Editing" filter, which allows you to flexibly configure the conditions for editing records for users and roles depending on the configured conditions.
- Added the "Change only" function - when you restart the generation of objects, the existing records that the system finds by mapping levels and constants will be updated, and in the existing ones, the numerical columns from the planning indicators will be changed.
- Added a validation mechanism for generating planning objects - By setting up validation conditions, if a validation condition is found when generating an object, the planning object will not be generated.
- Added the ability to start object generation only for selected records.
- The ability to configure constants as parameters when generating objects has been added, which allows you to edit additional values of constants when generating objects and make them mandatory, otherwise the object will not be generated.
- Added the ability to recalculate columns with actual values after generating objects.
- DM 360
Ability to display planning levels in column format. Control over the order of column levels.
For example, delivery conditions or budget items are not in a hierarchy but in the columns of the planning grid. - Tabular View
Ability to display planning in the form of a flat table, similar to Excel. There is no hierarchy, and all levels are displayed in different columns of the same row. - Dynamic Structure
Ability to combine the previous points and customize the display format for each of the levels.
For example, at the first level, display all derivatives from the counterparty, and then in the hierarchy, provide detailed information down to the products. - Planning Permissions Configuration
Configuration of permissions for planning operations in the new interface. The ability to configure permissions separately for each planning.
For instance, by default, the Managers group cannot add new entries to the hierarchy grids of all planning, but they can do so for a specific planning. - Custom Actions
Ability to configure individual buttons in the grid and set up additional logic or initiate business processes from them.
For example, one button can trigger Update, Calculation, Record Generation, and for each of the generated records, a business process can be launched. - Safari Support
Product packages conversion to assembly packages
Drilldown planning cells
- The ability to view the raw data on the basis of which the value of the indicator was calculated.
- The ability to open a section with data with a pre-configured filter according to which the value was calculated. For example, view the list of orders or shipments based on which the sales fact cell was calculated.
Editing of simple values only
- The ability to configure access to data record only in simple lines, while grouping lines are blocked. For example, the ability to enter planning data only by a specific customer and by a specific product, without the ability to enter values at the customer level with automatic downward distribution.
Rights to edit periods
- The ability to configure editing rights for certain periods separately for each column, in terms of different roles. For example, users (all or with a certain role) can edit only future and current periods (or only the next 3).
Additional level columns
- The ability to display additional columns for the records of each level in addition to the name, the ability to export them to Excel, search for them when importing from Excel.For example, for a product, display the Code, export it to a file. When importing, the column with the level is not mandatory, the system will search for the record of the level by code, or when there are several records with the same name, but a different code.
Comments
- Ability to add comments to certain cells of the planning grid. Displaying the author and the time the comment was added. Conducting a dialogue between users in a certain cell. Linking comments to system objects.
Hiding dashboard data labels
- Ability to hide data labels in dashboards with a large amount of data, when they overlap each other and do not look attractive
Launch planning processes from the section
- The ability to run the main planning processes (Update, Calculation and others) from the section line for faster data updating.
- Automatic update of planning status in the section
Disable Lazyload
- Ability to disable Lazyload for small plans that don't need it.
Fixing some bugs
- Including copying profile periods
API to communicate with planning data has been added
- Ability to integrate external applications with Data Management. For example, take data from the BI system.
Manual app installation
- Open the needed app → the Packages tab - download the Markeplace app files.
- Click in the top right → Application Hub
- Click New application. This opens a window.
- Select Install from file and click Select in the window that opens.
- Click Select file on the page of the Marketplace App Installation Wizard and specify the app file path.
When you make the first purchase or extend the product license, our experts will provide you with 8 hours of consultation and help with setting up the product.