Syntech Pivot for Creatio
Syntech Pivot for Creatio provides fast, flexible, and interactive pivot tables directly in Creatio. It helps teams analyze data from any section, build multi-dimensional reports without developers, and make data-driven decisions faster.
Overview


Product overview
Product description
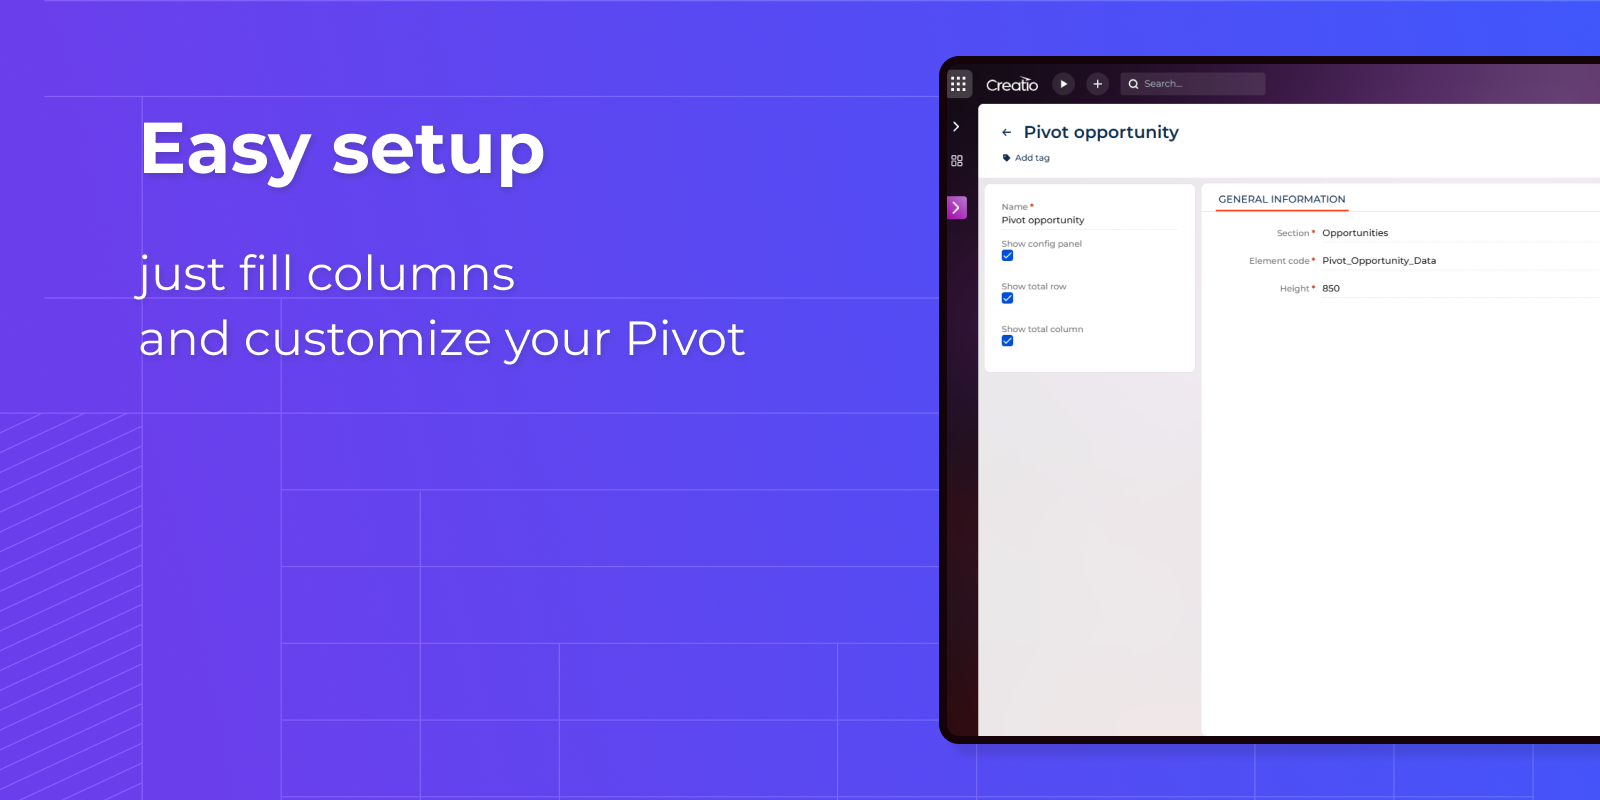
Syntech Pivot for Creatio adds pivot-table functionality directly into Creatio.
Users can create interactive pivot tables from any section (standard or custom), slice and dice data in real time, and build ad-hoc reports without developer involvement or exporting to spreadsheets.
Key Features

Pivot Tables Embedded in Creatio
Build pivot reports directly from:
Standard Creatio sections (e.g., Contacts, Accounts, Opportunities, Orders, Cases)
Custom objects and industry-specific sections.
Use Creatio data sources and filters you already know – no external tools required.
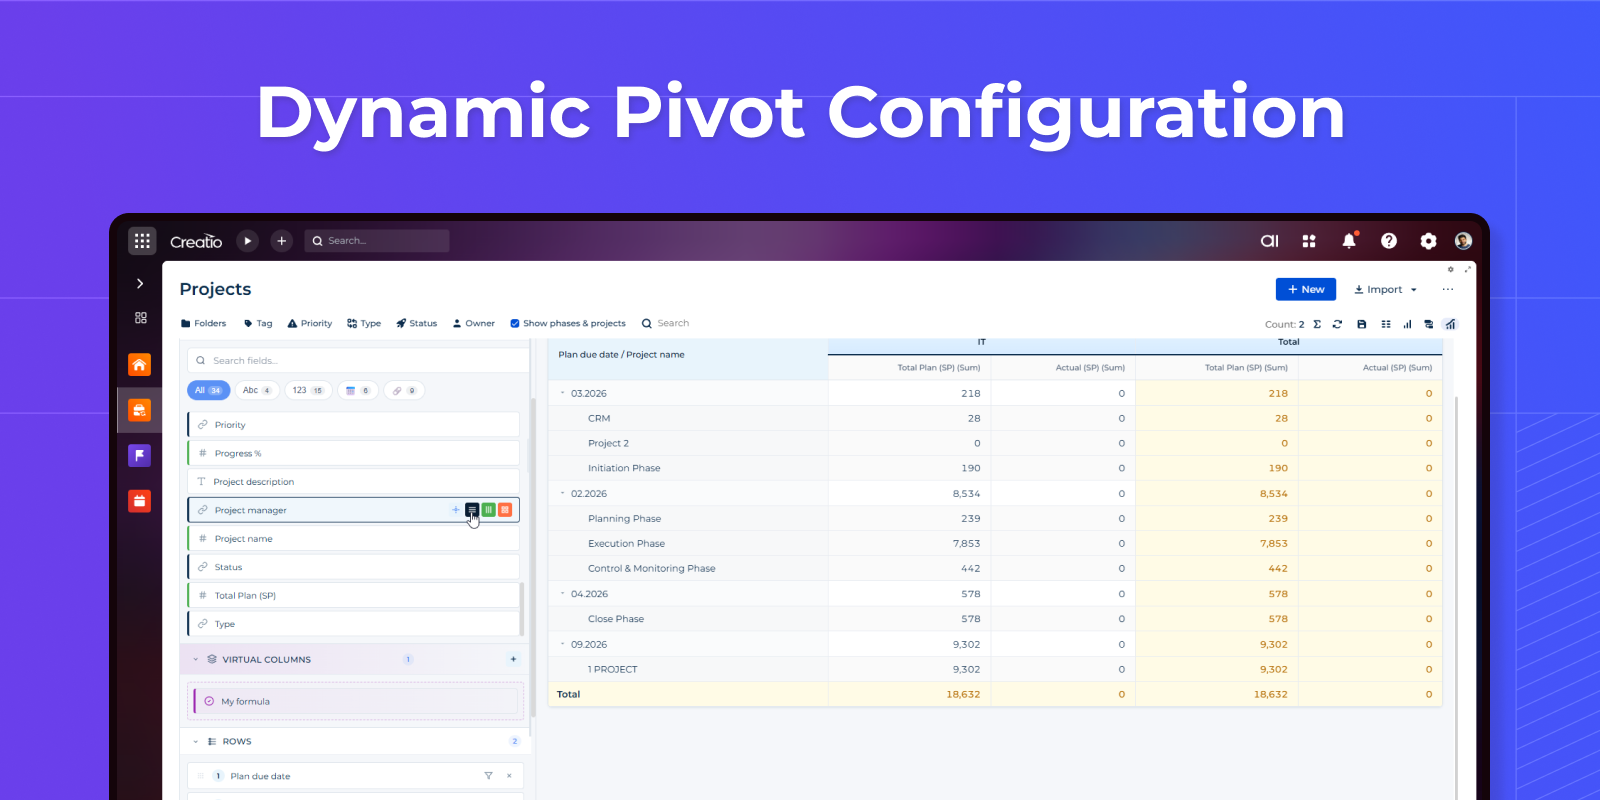
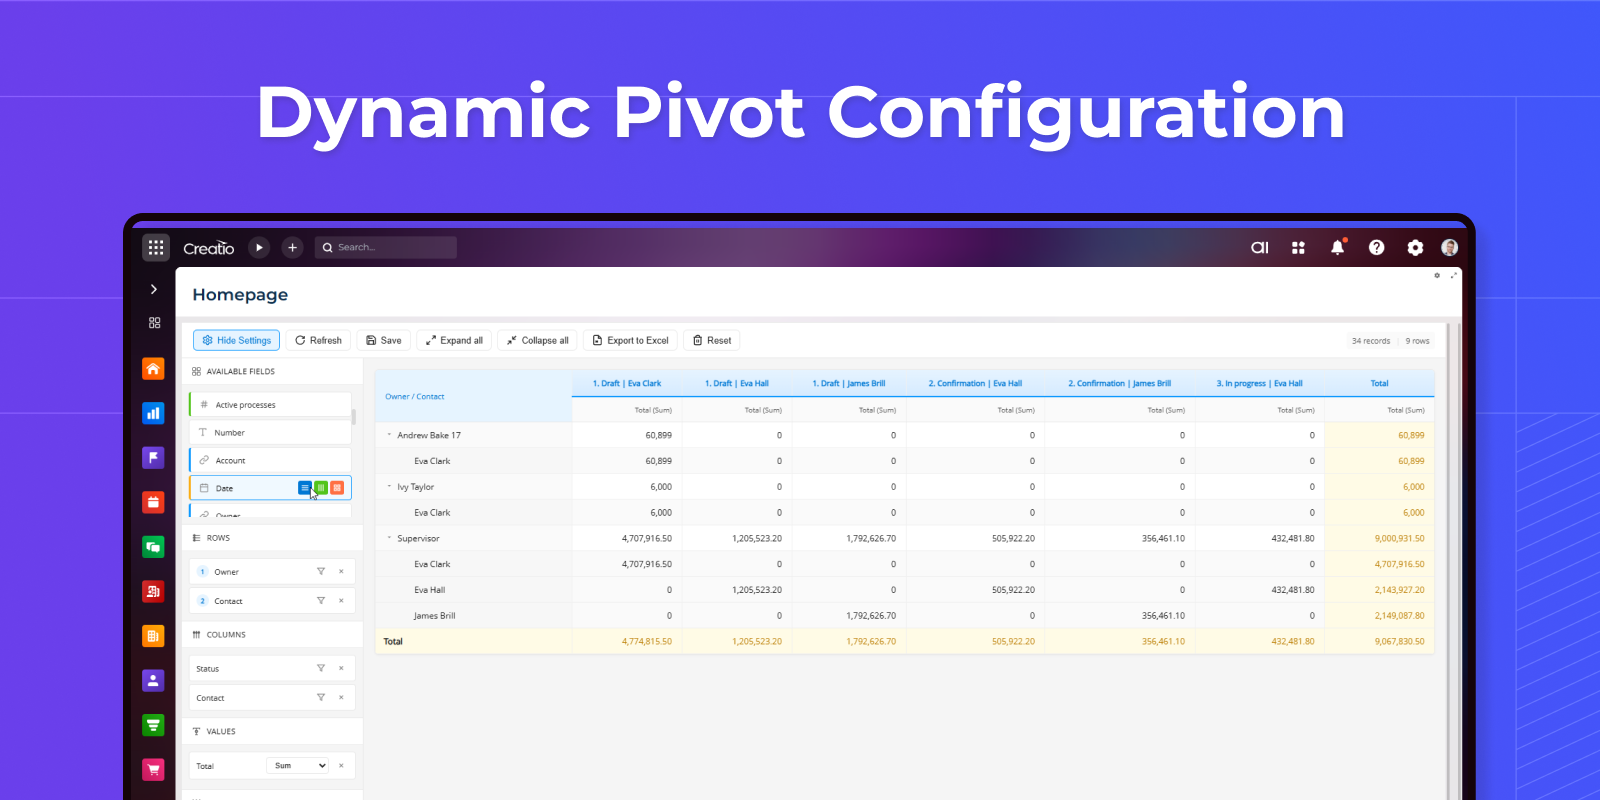
Drag-and-Drop Pivot Designer
Intuitive pivot layout:
Rows – for dimensions like Account, Manager, Product, Region.
Columns – for time periods, stages, segments, etc.
Values – for metrics (Amount, Count, Margin, Duration, etc.).
Filters – to narrow down the dataset quickly.
Users can rearrange fields on the fly to answer new questions in seconds.
Reorder fields within Rows, Columns, and Values sections by dragging. Grab the handle icon (⋮⋮) and drop to new position. Changes are saved automatically.
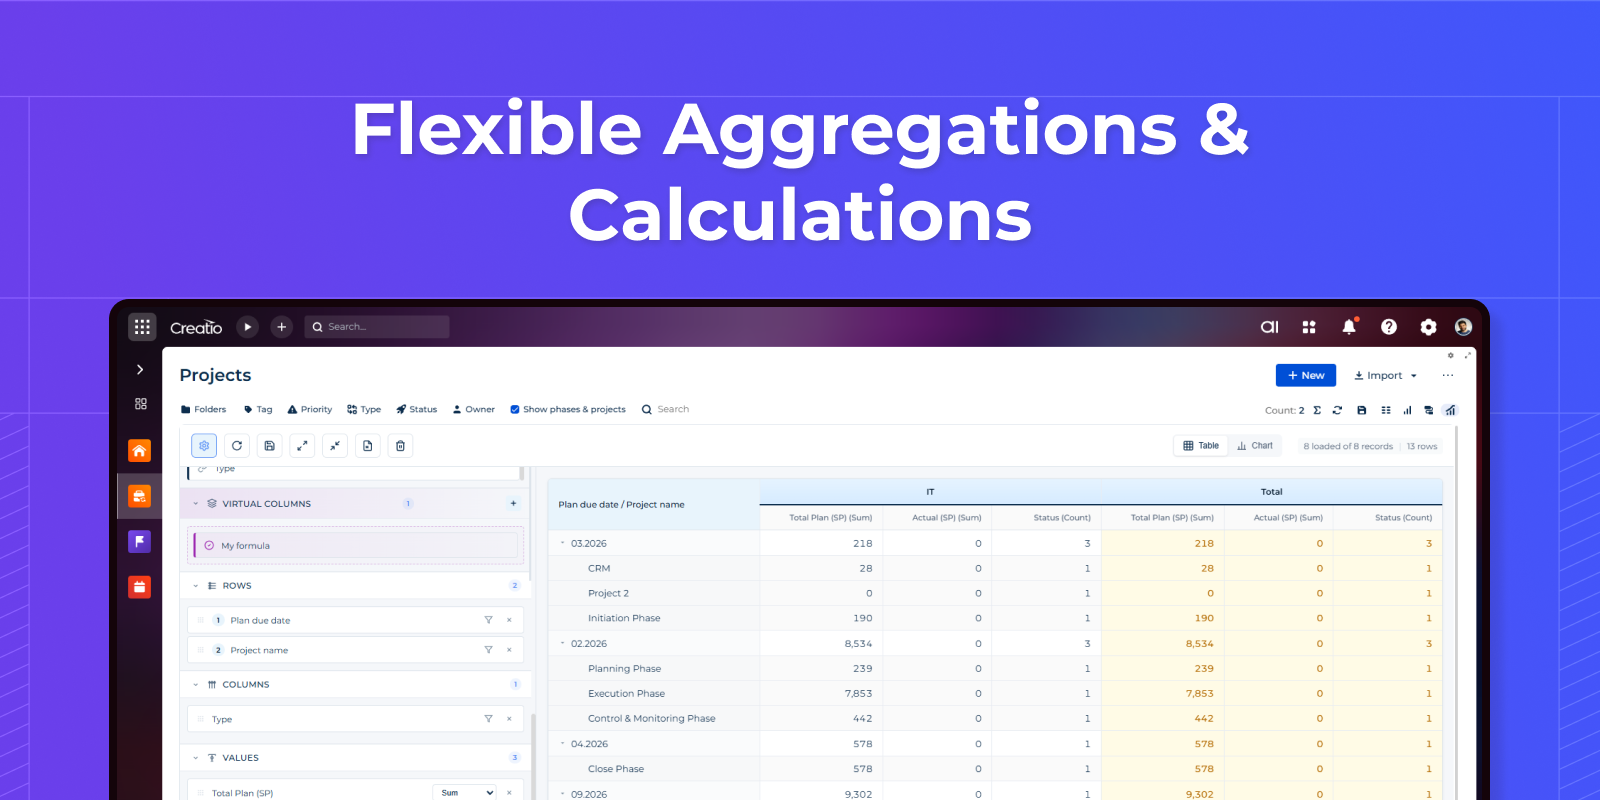
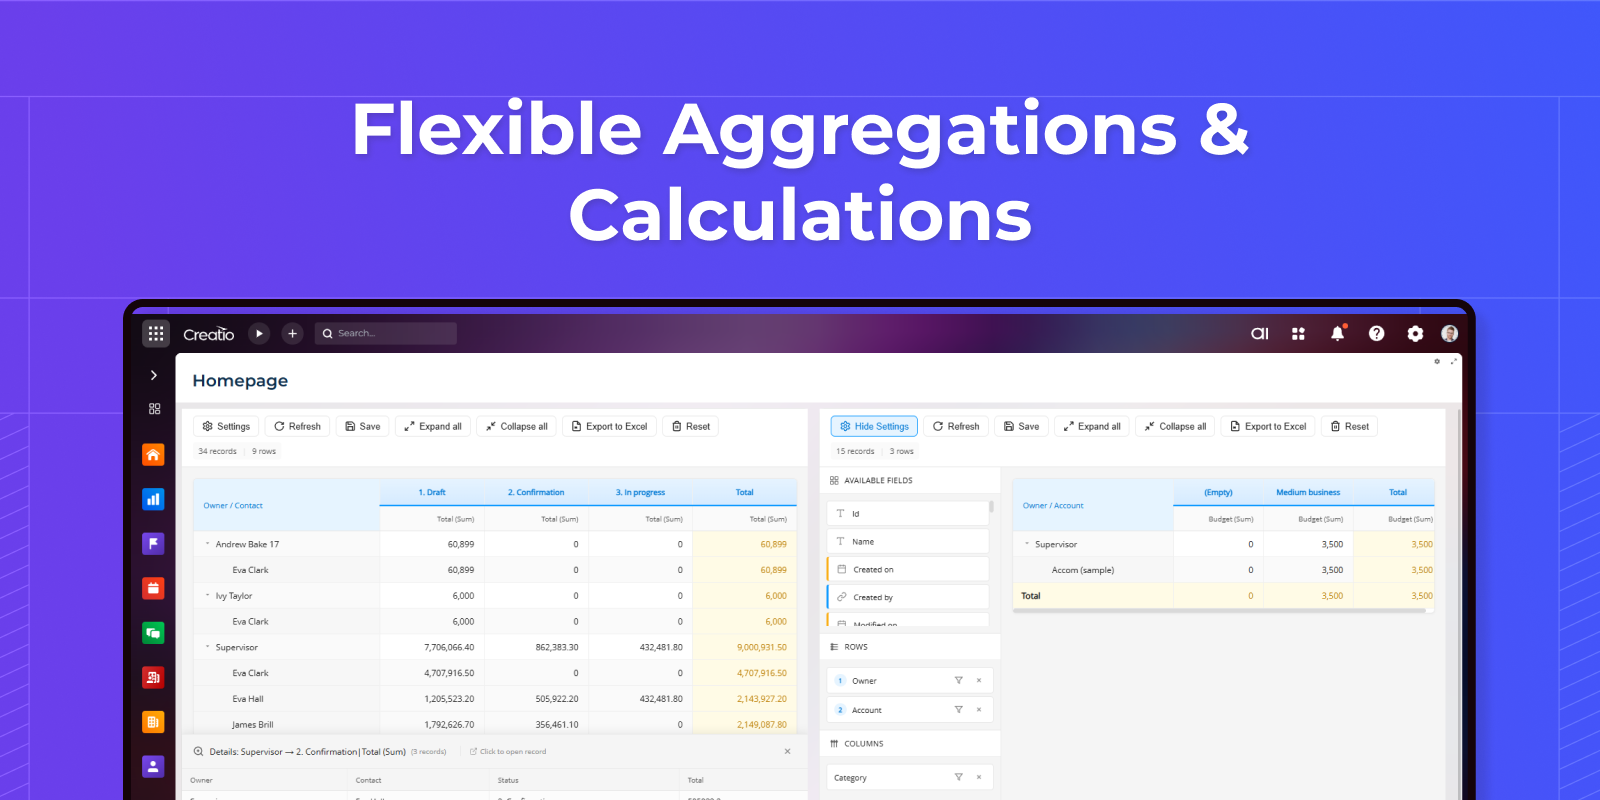
Flexible Aggregations & Calculations
Supported aggregations (depending on column type), for example:
Sum, Count, Average, Min, Max
Ability to combine several measures in one pivot (e.g., Sum of Amount, Count of Opportunities, Average Check).
Grouping by:
Lookup fields (owner, account, segment, industry)
Date fields (year, quarter, month, day)
Categories and custom classification fields.
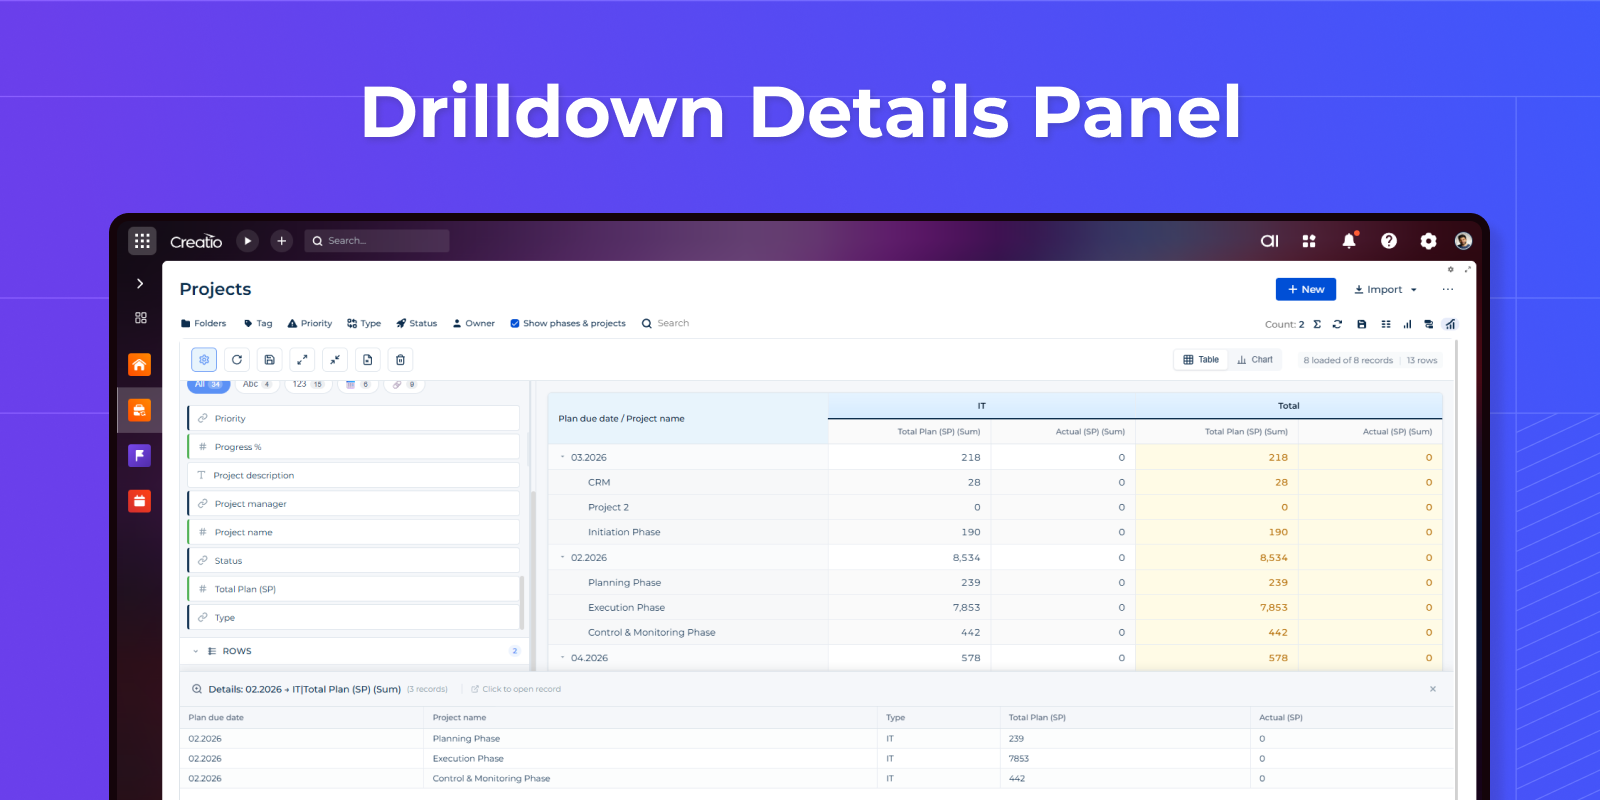
Drilldown to Source Records
Click any cell value to view source records in an expandable panel. It shows all contributing records with relevant columns. Click any row to open the full record in Creatio's standard edit page via native navigation.
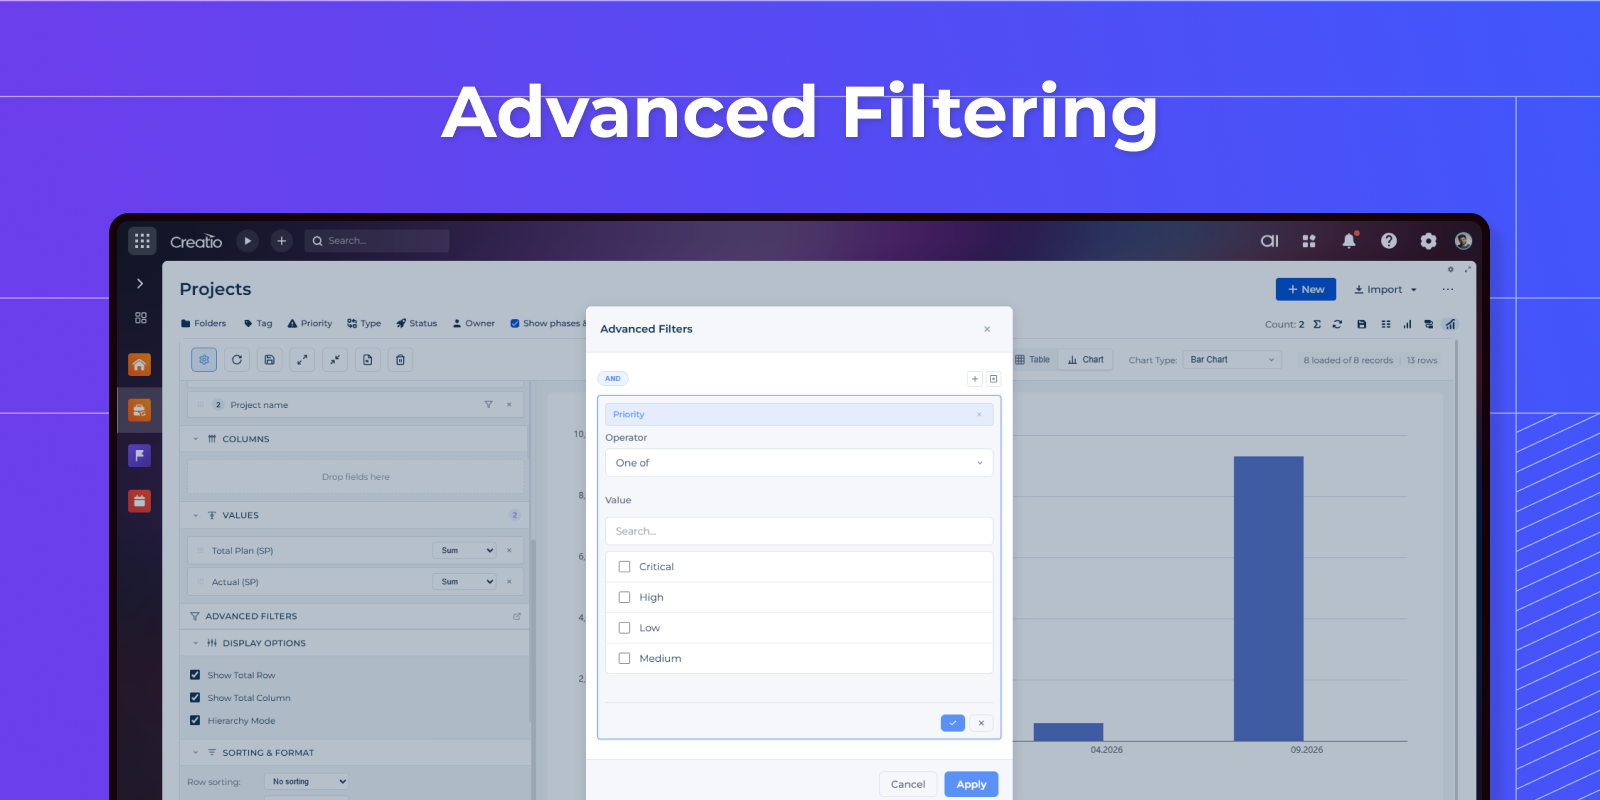
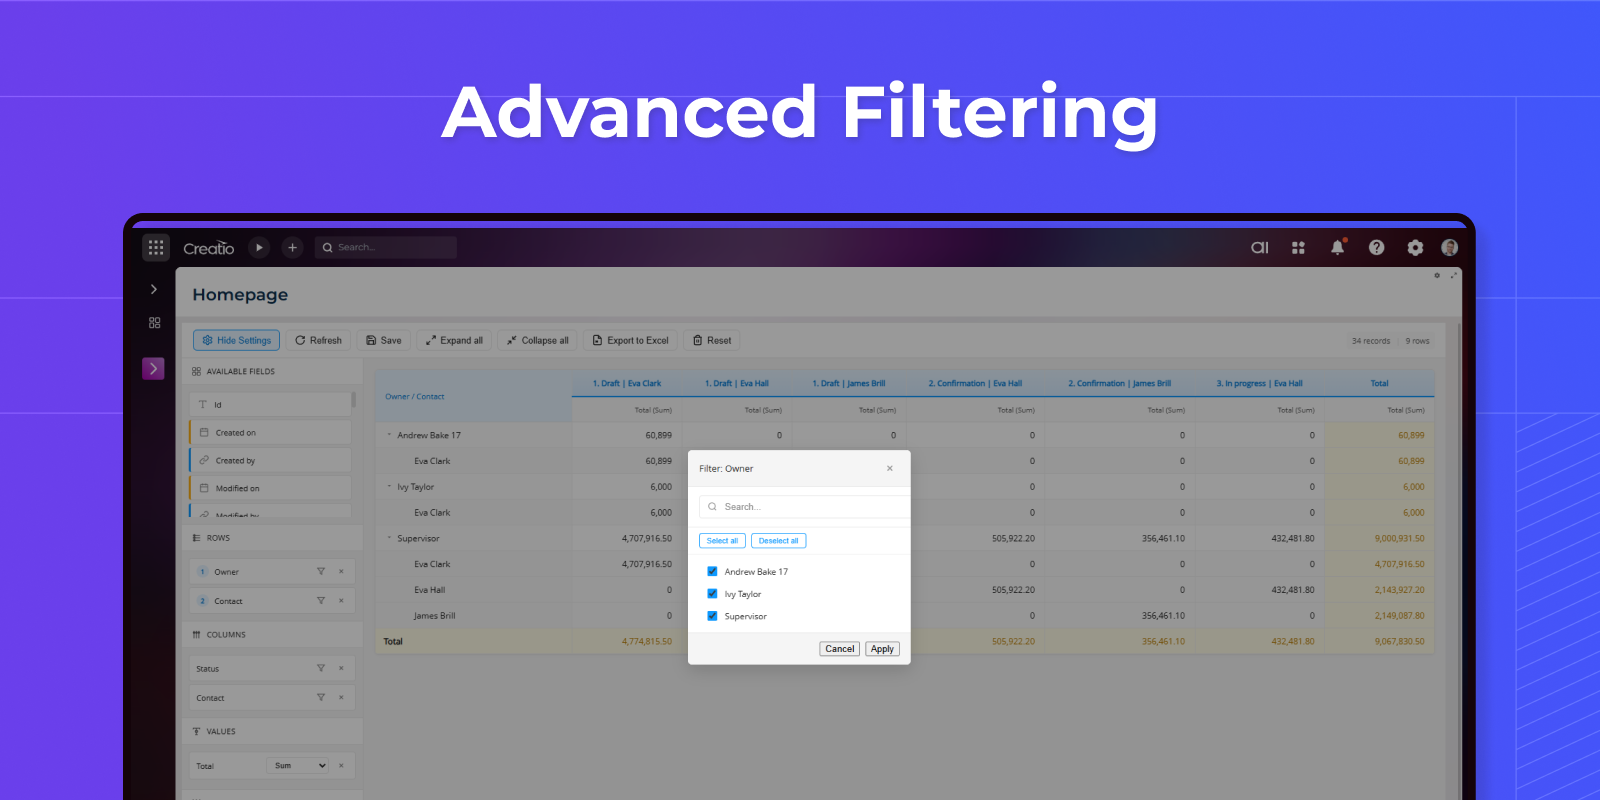
Advanced Filtering
Row and column filtering with multi-select modal dialogs. Users can filter data by any field value with search functionality.
Automatically respects filters applied on the Freedom UI page. Works with folder filters, quick filters, and advanced filters. Pivot data updates in real-time when page filters change - ensuring consistent data view across the page.
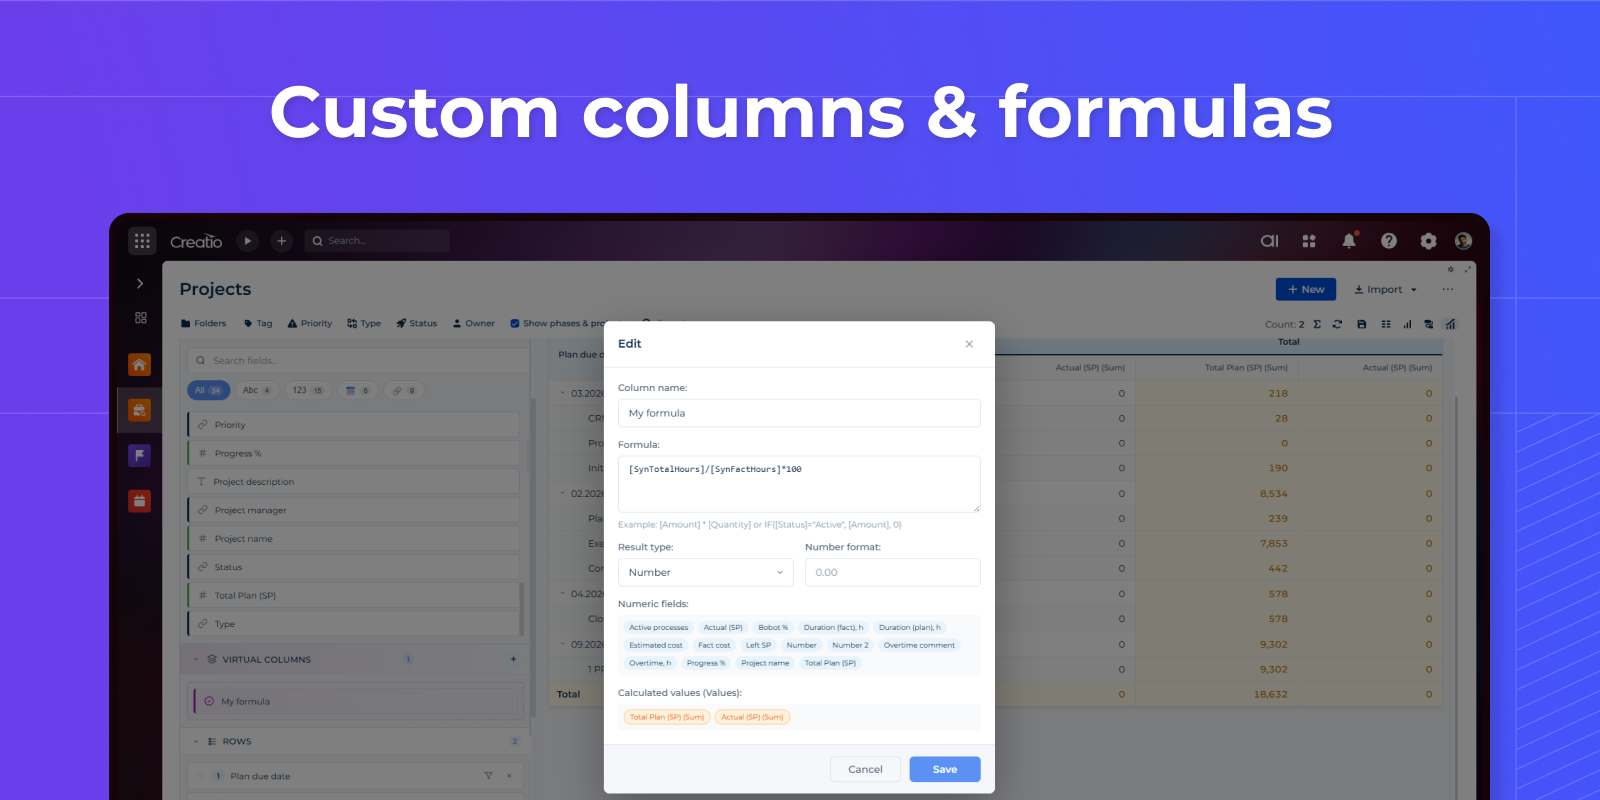
Custom columns & formulas
Create calculated fields that derive values from other aggregated data in your pivot table. Virtual columns perform calculations on already-aggregated values (sums, counts, averages) rather than raw data rows.
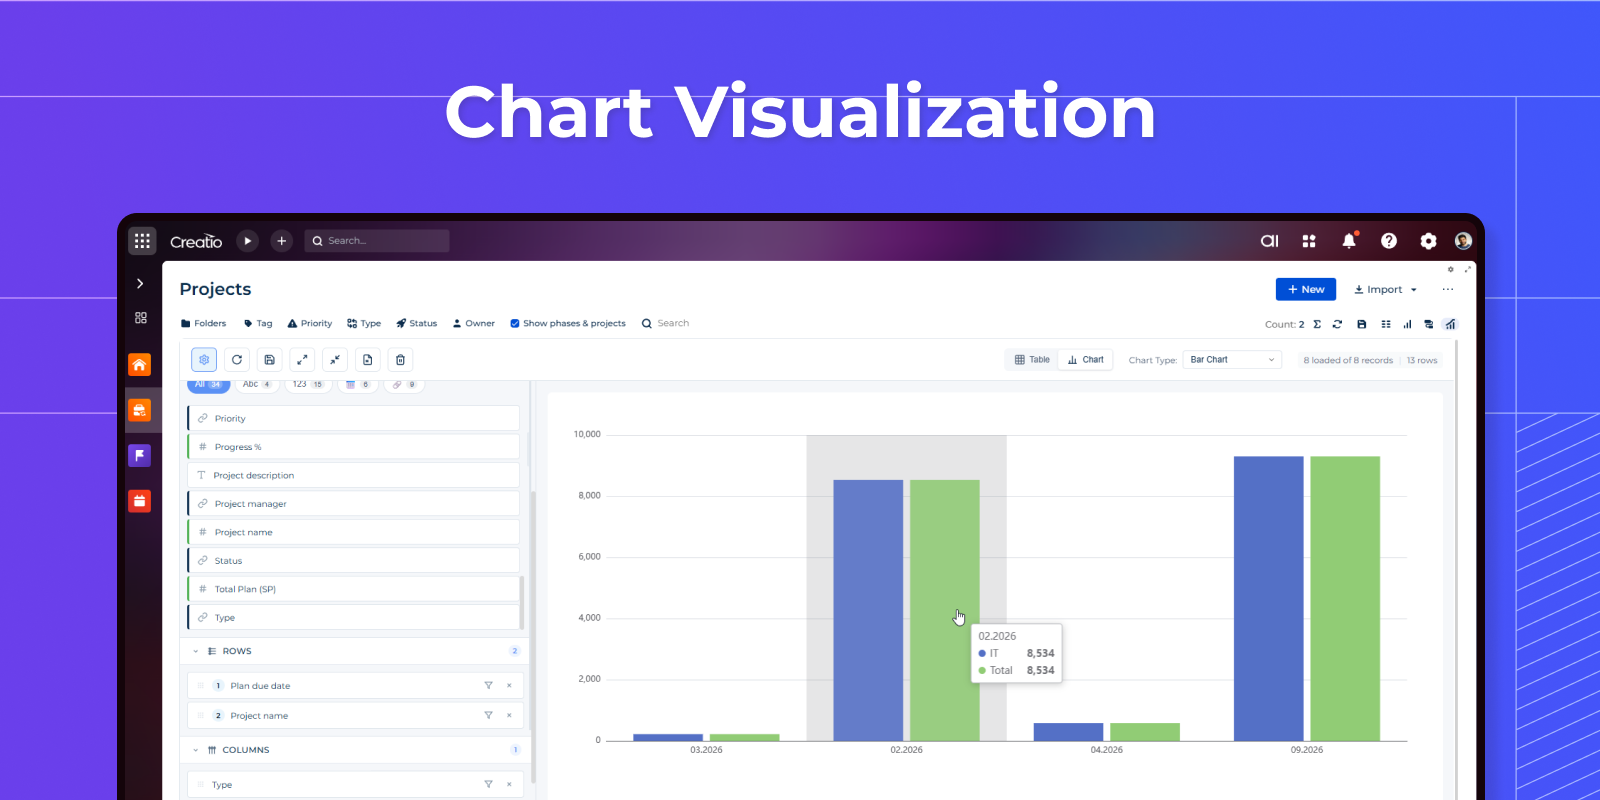
Chart Visualization
Toggle between table and chart view with 9 chart types:
Bar charts: Bar, Stacked Bar, Horizontal Bar
Line charts: Line, Spline (smooth), Area
Circular charts: Pie, Donut
Matrix: Heatmap
Charts support multiple values - each value creates a separate series. For Pie/Donut charts with multiple values, multiple mini-charts are displayed in a grid layout.
View mode (table/chart) and chart type are saved to database and restored on component load.
Pricing
Monthly
Annual
Standard
$
100.00 / month
billed annually
Terms and Conditions
By installing this product you agree to terms and conditions outlined in the license agreement.
Support
Support is available for this application
Support is provided by the developer within the “Basic”, “Business” and “Premium“ packages. Detailed information about the support packages and the support terms can be found on the Creatio website.
Installation
Resources
Data sharing
- By installing or downloading the App, you confirm that you agree with sharing your account data (name, email, phone, company and country) with the App Developer as their End User.
- The App Developer will process your data under their privacy policy.
Versions
Versions history
Version
Compatibility
Release date
1.3
8.3.1
1.2
8.3.1
1.0.1
8.3.1
1.0.0
8.3.1
Manual app installation
- Open the needed app → the Packages tab - download the Markeplace app files.
- Click in the top right → Application Hub
- Click New application. This opens a window.
- Select Install from file and click Select in the window that opens.
- Click Select file on the page of the Marketplace App Installation Wizard and specify the app file path.